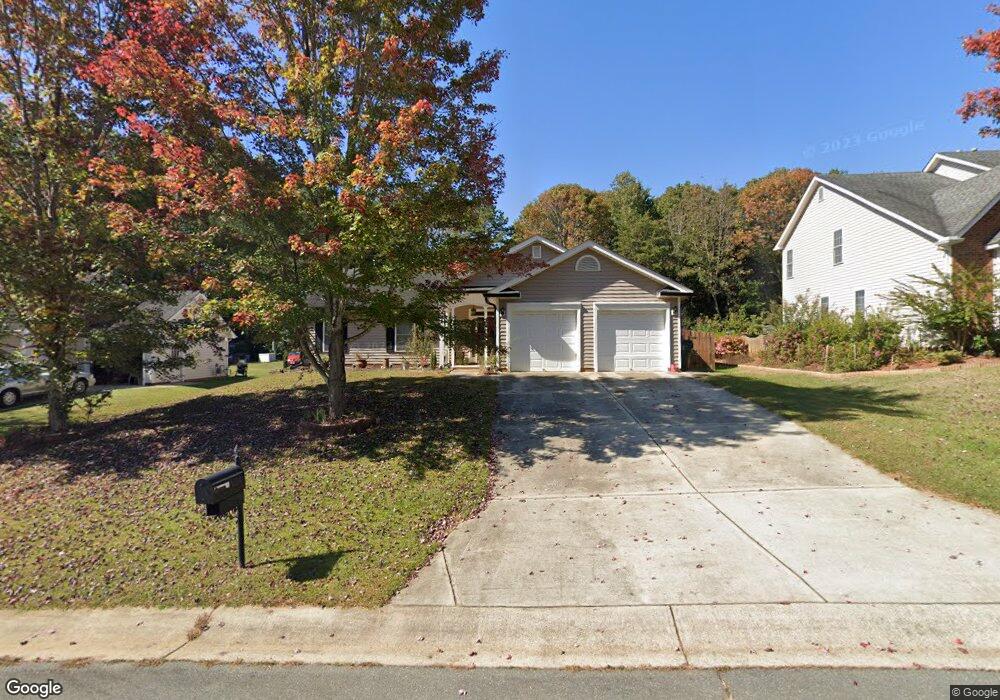
1334 Commonwealth Ct Graham, NC 27253
South Burlington NeighborhoodEstimated Value: $300,000 - $314,000
3
Beds
2
Baths
1,548
Sq Ft
$197/Sq Ft
Est. Value
About This Home
This home is located at 1334 Commonwealth Ct, Graham, NC 27253 and is currently estimated at $305,273, approximately $197 per square foot. 1334 Commonwealth Ct is a home located in Alamance County with nearby schools including South Graham Elementary School, Southern Alamance Middle School, and Southern Alamance High School.
Ownership History
Date
Name
Owned For
Owner Type
Purchase Details
Closed on
Mar 11, 2010
Sold by
Hart Kristen
Bought by
Cox Tara
Current Estimated Value
Home Financials for this Owner
Home Financials are based on the most recent Mortgage that was taken out on this home.
Original Mortgage
$160,500
Outstanding Balance
$106,535
Interest Rate
5.01%
Mortgage Type
New Conventional
Estimated Equity
$198,738
Purchase Details
Closed on
Nov 15, 2006
Sold by
Harrigan David P
Bought by
Hart Kristen D
Home Financials for this Owner
Home Financials are based on the most recent Mortgage that was taken out on this home.
Original Mortgage
$143,000
Interest Rate
6.31%
Mortgage Type
VA
Purchase Details
Closed on
Sep 30, 2003
Sold by
D R Horton Inc
Bought by
Harrigan David
Home Financials for this Owner
Home Financials are based on the most recent Mortgage that was taken out on this home.
Original Mortgage
$144,674
Interest Rate
6.24%
Mortgage Type
FHA
Create a Home Valuation Report for This Property
The Home Valuation Report is an in-depth analysis detailing your home's value as well as a comparison with similar homes in the area
Home Values in the Area
Average Home Value in this Area
Purchase History
| Date | Buyer | Sale Price | Title Company |
|---|---|---|---|
| Cox Tara | $161,000 | -- | |
| Hart Kristen D | $143,000 | -- | |
| Harrigan David | $147,000 | -- |
Source: Public Records
Mortgage History
| Date | Status | Borrower | Loan Amount |
|---|---|---|---|
| Open | Cox Tara | $160,500 | |
| Previous Owner | Hart Kristen D | $143,000 | |
| Previous Owner | Harrigan David | $144,674 |
Source: Public Records
Tax History
| Year | Tax Paid | Tax Assessment Tax Assessment Total Assessment is a certain percentage of the fair market value that is determined by local assessors to be the total taxable value of land and additions on the property. | Land | Improvement |
|---|---|---|---|---|
| 2025 | $1,330 | $269,181 | $34,000 | $235,181 |
| 2024 | $1,262 | $269,181 | $34,000 | $235,181 |
| 2023 | $2,452 | $269,181 | $34,000 | $235,181 |
| 2022 | $1,965 | $158,345 | $30,000 | $128,345 |
| 2021 | $1,981 | $158,345 | $30,000 | $128,345 |
| 2020 | $1,997 | $158,345 | $30,000 | $128,345 |
| 2019 | $2,002 | $158,345 | $30,000 | $128,345 |
| 2018 | $941 | $158,345 | $30,000 | $128,345 |
| 2017 | $914 | $158,345 | $30,000 | $128,345 |
| 2016 | $1,660 | $143,140 | $30,000 | $113,140 |
| 2015 | $826 | $143,140 | $30,000 | $113,140 |
| 2014 | $755 | $143,140 | $30,000 | $113,140 |
Source: Public Records
Map
Nearby Homes
- 1338 Commonwealth Ct
- 1328 Commonwealth Ct
- 1320 Commonwealth Ct
- 1616 Bancroft Ct
- 1346 Commonwealth Ct
- 1613 Bancroft Ct
- 1335 Commonwealth Ct
- 1314 Commonwealth Ct
- 1339 Commonwealth Ct
- 1329 Commonwealth Ct
- 1627 Hanford Hills Rd
- 1612 Bancroft Ct
- 1631 Hanford Hills Rd
- 1621 Hanford Hills Rd
- 1347 Commonwealth Ct
- 1321 Commonwealth Ct
- 1637 Hanford Hills Rd
- 1609 Bancroft Ct
- 1611 Handford Hills Rd
- 1611 Hanford Hills Rd
Your Personal Tour Guide
Ask me questions while you tour the home.