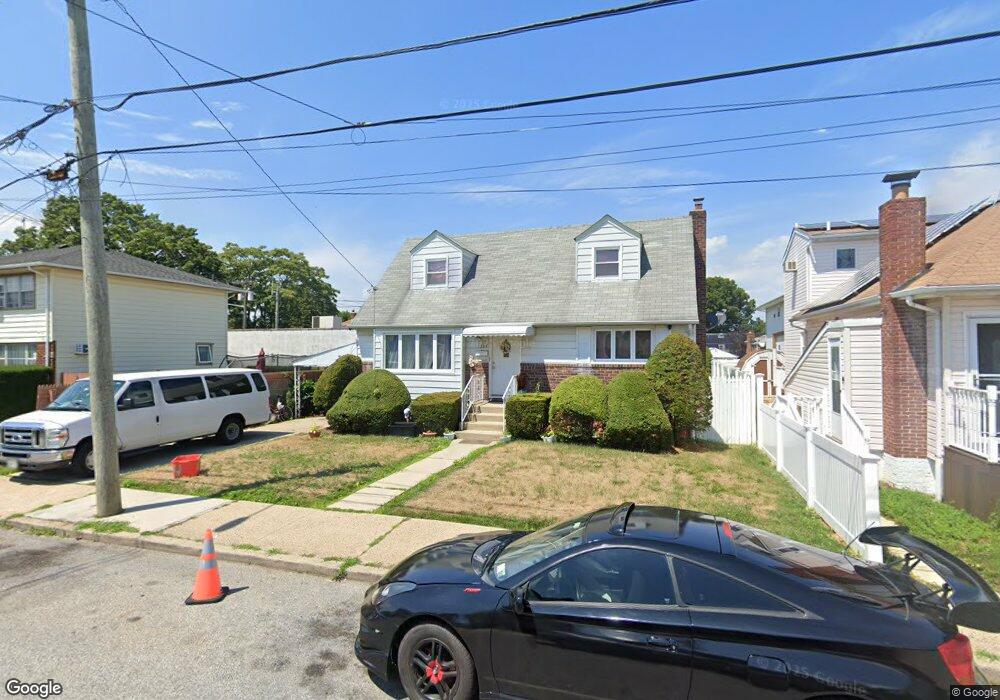
1334 E St Elmont, NY 11003
Estimated Value: $716,500 - $772,000
5
Beds
2
Baths
1,480
Sq Ft
$506/Sq Ft
Est. Value
About This Home
This home is located at 1334 E St, Elmont, NY 11003 and is currently estimated at $748,375, approximately $505 per square foot. 1334 E St is a home located in Nassau County with nearby schools including Cheder at the Ohel.
Ownership History
Date
Name
Owned For
Owner Type
Purchase Details
Closed on
Jul 13, 2016
Sold by
Zubko Diane M and Stellato Family 2010 Irrevocab
Bought by
Carchi Jose Fredi
Current Estimated Value
Home Financials for this Owner
Home Financials are based on the most recent Mortgage that was taken out on this home.
Original Mortgage
$381,816
Outstanding Balance
$312,323
Interest Rate
4.37%
Mortgage Type
FHA
Estimated Equity
$436,052
Purchase Details
Closed on
Dec 22, 2010
Sold by
Stellato Janet
Bought by
Zubko Diane M and The Stellato Family 2010 Irrevocable T
Create a Home Valuation Report for This Property
The Home Valuation Report is an in-depth analysis detailing your home's value as well as a comparison with similar homes in the area
Home Values in the Area
Average Home Value in this Area
Purchase History
| Date | Buyer | Sale Price | Title Company |
|---|---|---|---|
| Carchi Jose Fredi | $396,550 | Fidelity National Title Insu | |
| Zubko Diane M | -- | -- |
Source: Public Records
Mortgage History
| Date | Status | Borrower | Loan Amount |
|---|---|---|---|
| Open | Carchi Jose Fredi | $381,816 |
Source: Public Records
Tax History
| Year | Tax Paid | Tax Assessment Tax Assessment Total Assessment is a certain percentage of the fair market value that is determined by local assessors to be the total taxable value of land and additions on the property. | Land | Improvement |
|---|---|---|---|---|
| 2025 | $11,791 | $477 | $212 | $265 |
| 2024 | $3,648 | $477 | $212 | $265 |
Source: Public Records
Map
Nearby Homes
Your Personal Tour Guide
Ask me questions while you tour the home.