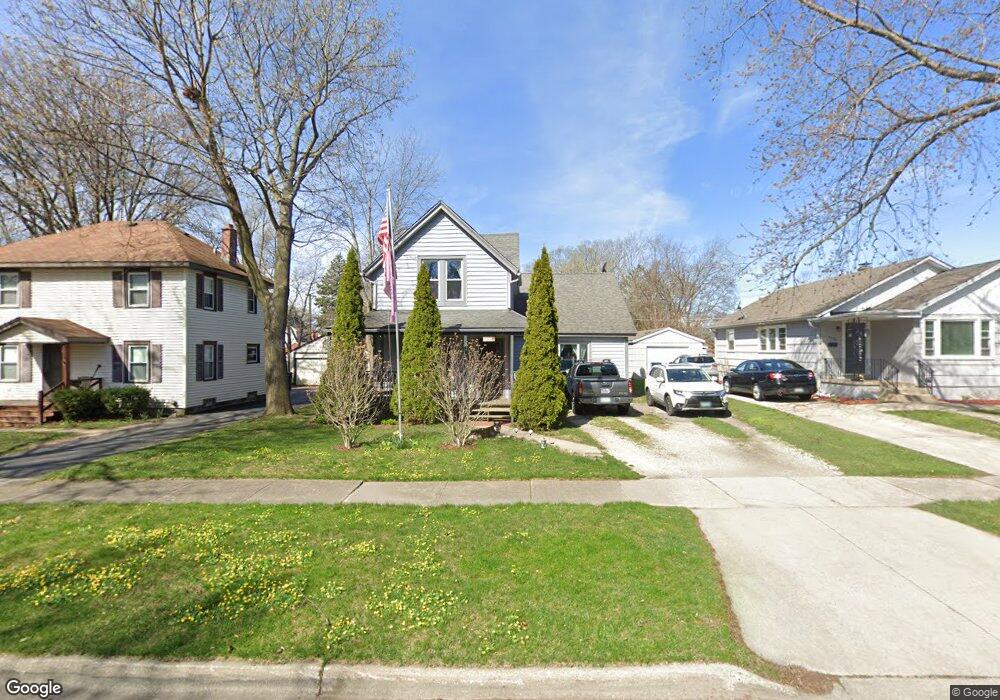
1334 N Ash St Waukegan, IL 60085
Estimated Value: $241,000 - $333,000
3
Beds
3
Baths
2,189
Sq Ft
$133/Sq Ft
Est. Value
About This Home
This home is located at 1334 N Ash St, Waukegan, IL 60085 and is currently estimated at $292,129, approximately $133 per square foot. 1334 N Ash St is a home located in Lake County with nearby schools including Glen Flora Elementary School, Edith M Smith Middle School, and Waukegan High School.
Ownership History
Date
Name
Owned For
Owner Type
Purchase Details
Closed on
Sep 29, 2006
Sold by
Sprandel Denise and Siebeneck Denise
Bought by
Siebeneck Denise and Siebeneck Robert
Current Estimated Value
Purchase Details
Closed on
Aug 23, 2006
Sold by
Sprandel Denise and Siebeneck Robert
Bought by
Sprandel Denise
Purchase Details
Closed on
Feb 7, 2006
Sold by
Sprandel Denise R
Bought by
Sprandel Denise R and Siebeneck Robert C
Purchase Details
Closed on
Feb 5, 2004
Sold by
Mackey Nathan O
Bought by
Sprandel Denise R
Purchase Details
Closed on
Jun 26, 2000
Sold by
Nusser Leonard W and Nusser Cynthia K
Bought by
Mackey Nathan O
Home Financials for this Owner
Home Financials are based on the most recent Mortgage that was taken out on this home.
Original Mortgage
$115,542
Interest Rate
8.64%
Mortgage Type
FHA
Create a Home Valuation Report for This Property
The Home Valuation Report is an in-depth analysis detailing your home's value as well as a comparison with similar homes in the area
Home Values in the Area
Average Home Value in this Area
Purchase History
| Date | Buyer | Sale Price | Title Company |
|---|---|---|---|
| Siebeneck Denise | -- | None Available | |
| Sprandel Denise | -- | None Available | |
| Sprandel Denise R | -- | None Available | |
| Sprandel Denise R | -- | -- | |
| Mackey Nathan O | $116,500 | First American Title Ins Co |
Source: Public Records
Mortgage History
| Date | Status | Borrower | Loan Amount |
|---|---|---|---|
| Previous Owner | Mackey Nathan O | $115,542 |
Source: Public Records
Tax History Compared to Growth
Tax History
| Year | Tax Paid | Tax Assessment Tax Assessment Total Assessment is a certain percentage of the fair market value that is determined by local assessors to be the total taxable value of land and additions on the property. | Land | Improvement |
|---|---|---|---|---|
| 2024 | $6,127 | $80,913 | $10,826 | $70,087 |
| 2023 | $5,856 | $72,973 | $9,764 | $63,209 |
| 2022 | $5,856 | $65,906 | $8,965 | $56,941 |
| 2021 | $5,512 | $58,874 | $7,997 | $50,877 |
| 2020 | $5,537 | $54,848 | $7,450 | $47,398 |
| 2019 | $5,520 | $50,260 | $6,827 | $43,433 |
| 2018 | $4,998 | $45,039 | $9,663 | $35,376 |
| 2017 | $4,815 | $39,847 | $8,549 | $31,298 |
| 2016 | $4,424 | $34,626 | $7,429 | $27,197 |
| 2015 | $4,222 | $30,991 | $6,649 | $24,342 |
| 2014 | $4,518 | $32,242 | $6,069 | $26,173 |
| 2012 | $3,913 | $34,932 | $6,576 | $28,356 |
Source: Public Records
Map
Nearby Homes
- 1336 N Ash St
- 1335 Chestnut St
- 1110 N Ash St
- 616 W Keith Ave
- 1312 N Linden Ave
- 1018 W Atlantic Ave
- 1105 Woodlawn Cir
- 918 N Ash St
- 415 W Ridgeland Ave
- 917 N Linden Ave
- 1000 Pine St
- 1504 W Glen Flora Ave
- 1109 Massena Ave
- 1905 Linden Ave
- 1117 Judge Ave
- 620 N Poplar St
- 824 N Butrick St
- 723 N County St
- 702 Franklin St
- 325 4th St
- 1332 N Ash St
- 1326 N Ash St
- 1342 N Ash St
- 1344 N Ash St
- 717 W Grove Ave
- 1331 Chestnut St
- 1327 Chestnut St
- 1331 N Ash St Unit 2
- 1331 N Ash St Unit 1
- 1316 N Ash St
- 1325 Chestnut St
- 1343 Chestnut St
- 1327 N Ash St
- 1321 Chestnut St
- 1335 N Ash St
- 725 W Grove Ave
- 1323 N Ash St
- 1339 N Ash St
- 1314 N Ash St
- 1319 Chestnut St