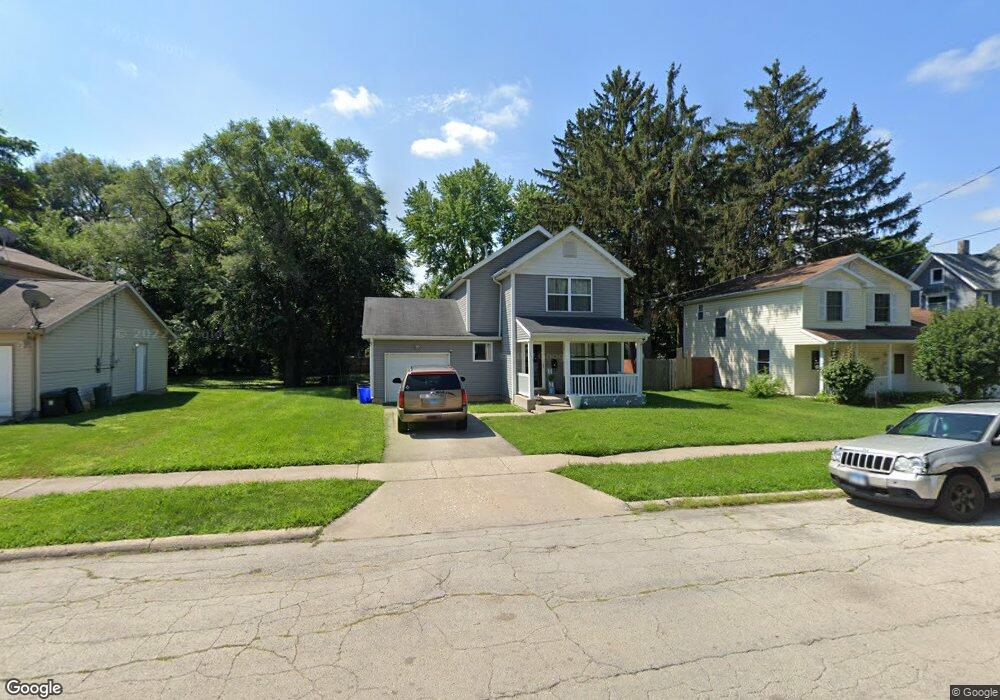
1335 4th Ave Rockford, IL 61104
Midtown District NeighborhoodEstimated Value: $88,000 - $155,000
3
Beds
2
Baths
1,460
Sq Ft
$89/Sq Ft
Est. Value
About This Home
This home is located at 1335 4th Ave, Rockford, IL 61104 and is currently estimated at $129,294, approximately $88 per square foot. 1335 4th Ave is a home located in Winnebago County with nearby schools including Constance Lane Elementary School, Abraham Lincoln Middle School, and Rockford East High School.
Ownership History
Date
Name
Owned For
Owner Type
Purchase Details
Closed on
Mar 8, 2019
Sold by
Federal Hm Ln Mtg Corp
Bought by
Hernandez Miguel G
Current Estimated Value
Purchase Details
Closed on
Oct 23, 2018
Sold by
Judicial Sales Corporation
Bought by
Federal Home Loan Mortgage Corporation
Purchase Details
Closed on
Oct 18, 2018
Sold by
Judicial Sales Corporation
Bought by
Federal Home Loan Mortgage Corporation
Purchase Details
Closed on
Apr 16, 2004
Bought by
Reddic Dorothy
Create a Home Valuation Report for This Property
The Home Valuation Report is an in-depth analysis detailing your home's value as well as a comparison with similar homes in the area
Home Values in the Area
Average Home Value in this Area
Purchase History
| Date | Buyer | Sale Price | Title Company |
|---|---|---|---|
| Hernandez Miguel G | $18,507 | Metropolitan Title Agency Inc | |
| Hernandez Miguel Garcia | $19,000 | Codilis & Associates Pc | |
| Federal Home Loan Mortgage Corporation | -- | Codilis & Associates Pc | |
| Federal Home Loan Mortgage Cor | -- | Codilis & Associates Pc | |
| Federal Home Loan Mortgage Corporation | -- | Codilis & Associates Pc | |
| Reddic Dorothy | $70,000 | -- |
Source: Public Records
Tax History Compared to Growth
Tax History
| Year | Tax Paid | Tax Assessment Tax Assessment Total Assessment is a certain percentage of the fair market value that is determined by local assessors to be the total taxable value of land and additions on the property. | Land | Improvement |
|---|---|---|---|---|
| 2024 | $2,455 | $25,906 | $4,525 | $21,381 |
| 2023 | $2,372 | $22,843 | $3,990 | $18,853 |
| 2022 | $2,333 | $20,417 | $3,566 | $16,851 |
| 2021 | $1,559 | $18,721 | $3,270 | $15,451 |
| 2020 | $1,504 | $17,698 | $3,091 | $14,607 |
| 2019 | $1,456 | $16,868 | $2,946 | $13,922 |
| 2018 | $1,543 | $15,897 | $2,777 | $13,120 |
| 2017 | $1,367 | $15,214 | $2,658 | $12,556 |
| 2016 | $1,653 | $16,941 | $2,608 | $14,333 |
| 2015 | $1,674 | $16,941 | $2,608 | $14,333 |
| 2014 | $2,107 | $19,813 | $3,255 | $16,558 |
Source: Public Records
Map
Nearby Homes