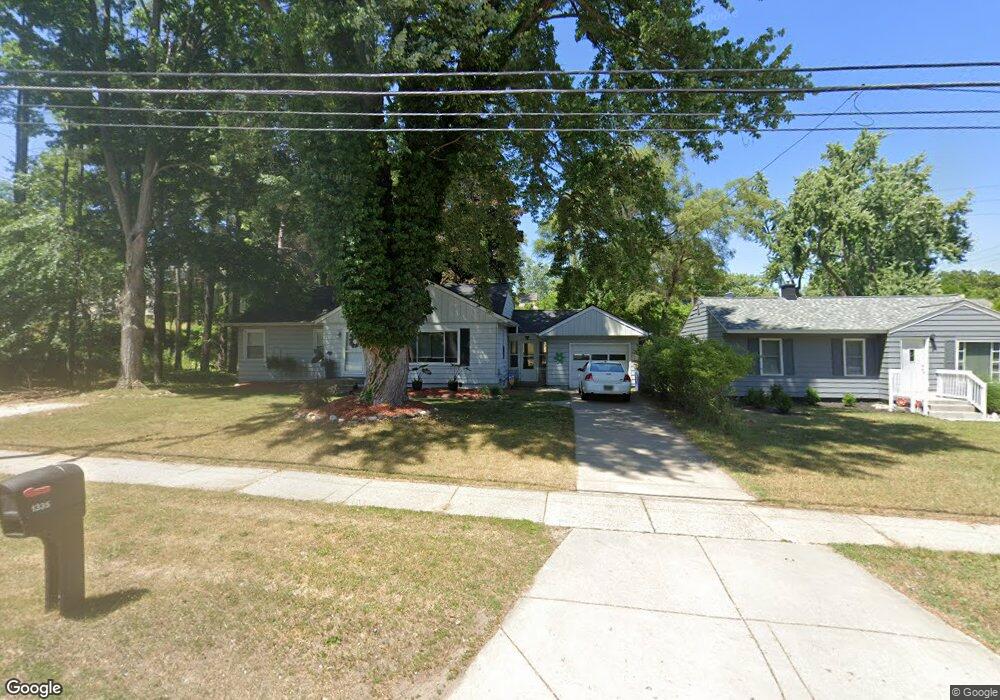
1335 Aberdeen St NE Grand Rapids, MI 49505
Creston NeighborhoodEstimated Value: $309,617 - $353,000
3
Beds
1
Bath
1,584
Sq Ft
$207/Sq Ft
Est. Value
About This Home
This home is located at 1335 Aberdeen St NE, Grand Rapids, MI 49505 and is currently estimated at $327,654, approximately $206 per square foot. 1335 Aberdeen St NE is a home located in Kent County with nearby schools including Riverside Middle School, Union High School, and All Saints Academy - Lower Campus.
Ownership History
Date
Name
Owned For
Owner Type
Purchase Details
Closed on
Nov 2, 2010
Sold by
Brucato Leonard A and Brucato Laura Ann
Bought by
Butgereit Jamie L and Butgereit James Brandon
Current Estimated Value
Home Financials for this Owner
Home Financials are based on the most recent Mortgage that was taken out on this home.
Original Mortgage
$102,815
Outstanding Balance
$68,181
Interest Rate
4.37%
Mortgage Type
FHA
Estimated Equity
$259,473
Purchase Details
Closed on
Apr 29, 2005
Sold by
Anderson Julie G
Bought by
Brucato Leonard A and Brucato Laura Ann
Home Financials for this Owner
Home Financials are based on the most recent Mortgage that was taken out on this home.
Original Mortgage
$122,000
Interest Rate
6.05%
Mortgage Type
Fannie Mae Freddie Mac
Purchase Details
Closed on
Dec 18, 1997
Sold by
Myles Myles M M and Myles S
Bought by
Anderson Julie G and Butgereit Jamie L James Brando
Purchase Details
Closed on
Jan 15, 1992
Sold by
Carr Carr J J and Carr Myles M
Bought by
Butgereit Jamie L James Brandon M
Create a Home Valuation Report for This Property
The Home Valuation Report is an in-depth analysis detailing your home's value as well as a comparison with similar homes in the area
Home Values in the Area
Average Home Value in this Area
Purchase History
| Date | Buyer | Sale Price | Title Company |
|---|---|---|---|
| Butgereit Jamie L | $104,200 | None Available | |
| Brucato Leonard A | $130,000 | -- | |
| Anderson Julie G | $87,000 | -- | |
| Butgereit Jamie L James Brandon M | $73,900 | -- |
Source: Public Records
Mortgage History
| Date | Status | Borrower | Loan Amount |
|---|---|---|---|
| Open | Butgereit Jamie L | $102,815 | |
| Previous Owner | Brucato Leonard A | $122,000 |
Source: Public Records
Tax History Compared to Growth
Tax History
| Year | Tax Paid | Tax Assessment Tax Assessment Total Assessment is a certain percentage of the fair market value that is determined by local assessors to be the total taxable value of land and additions on the property. | Land | Improvement |
|---|---|---|---|---|
| 2025 | $2,292 | $159,200 | $0 | $0 |
| 2024 | $2,292 | $146,300 | $0 | $0 |
| 2023 | $2,195 | $126,800 | $0 | $0 |
| 2022 | $2,208 | $110,100 | $0 | $0 |
| 2021 | $2,180 | $102,900 | $0 | $0 |
| 2020 | $2,084 | $96,600 | $0 | $0 |
| 2019 | $2,183 | $87,100 | $0 | $0 |
| 2018 | $2,108 | $77,100 | $0 | $0 |
| 2017 | $2,052 | $68,500 | $0 | $0 |
| 2016 | $2,077 | $61,800 | $0 | $0 |
| 2015 | $1,931 | $61,800 | $0 | $0 |
| 2013 | -- | $56,800 | $0 | $0 |
Source: Public Records
Map
Nearby Homes
- 1335 Northlawn St NE
- 1245 Kelsey St NE
- 2100 Dawson Ave NE
- 2027 Joan Ave NE
- 1335 Knapp St NE
- 1050 3 Mile Rd NE
- 921 Eleanor St NE
- 861 Aberdeen St NE
- 2700 Plainfield Ave NE
- 1824 Herrick Ave NE
- 778 Eleanor St NE
- 3030 Plainfield Ave NE
- 1119 Kentwood Dr NE
- 1946 Cross Bend St NE Unit 35
- 2037 Tall Meadow St NE Unit 13
- 1848 Emerald Ave NE
- 2856 Cheney Ave NE
- 2016 Tall Meadow St NE
- 738 Graceland St NE
- 1237 Dale Ct NE
- 1347 Aberdeen St NE
- 1325 Aberdeen St NE
- 1355 Aberdeen St NE
- 1340 Hollywood St NE
- 1344 Hollywood St NE
- 1334 Hollywood St NE
- 1350 Hollywood St NE
- 1328 Hollywood St NE
- 1361 Aberdeen St NE
- 1321 Aberdeen St NE
- 1354 Hollywood St NE
- 1324 Hollywood St NE
- 1332 Aberdeen St NE
- 1360 Hollywood St NE
- 1326 Aberdeen St NE
- 1315 Aberdeen St NE
- 1318 Hollywood St NE
- 1320 Aberdeen St NE
- 1339 Hollywood St NE
- 1345 Hollywood St NE