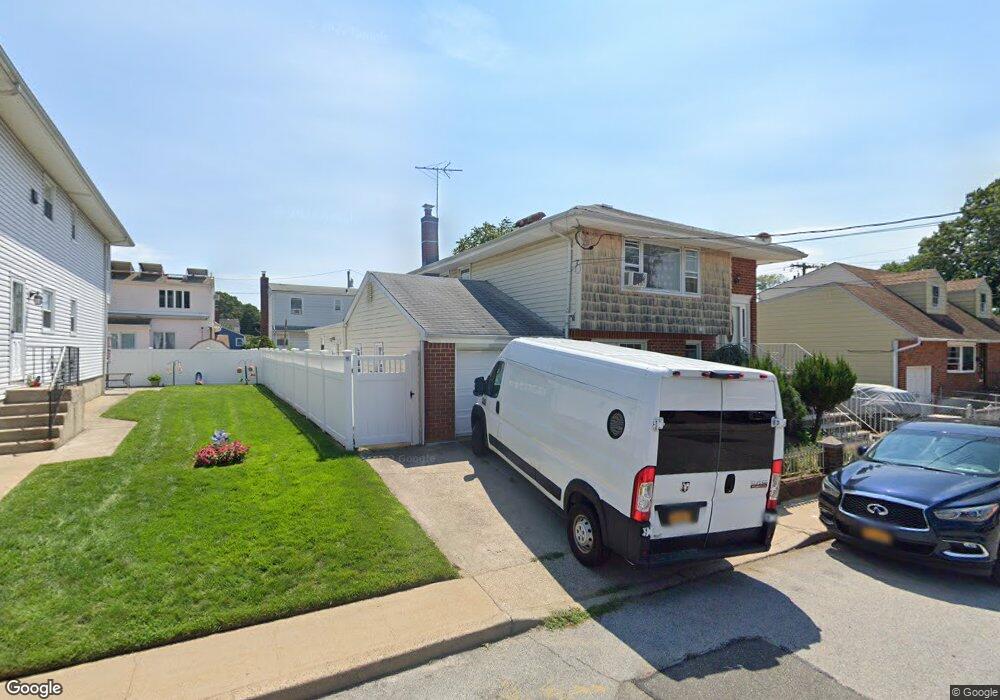
1335 D St Elmont, NY 11003
Estimated Value: $759,000 - $1,000,000
5
Beds
3
Baths
1,161
Sq Ft
$753/Sq Ft
Est. Value
About This Home
This home is located at 1335 D St, Elmont, NY 11003 and is currently estimated at $873,719, approximately $752 per square foot. 1335 D St is a home located in Nassau County with nearby schools including Cheder at the Ohel.
Ownership History
Date
Name
Owned For
Owner Type
Purchase Details
Closed on
Apr 1, 2014
Sold by
Panicker Mathai and Panicker Saramma
Bought by
Singh Mukhwinder
Current Estimated Value
Home Financials for this Owner
Home Financials are based on the most recent Mortgage that was taken out on this home.
Original Mortgage
$260,000
Outstanding Balance
$196,470
Interest Rate
4.26%
Mortgage Type
Cash
Estimated Equity
$677,249
Purchase Details
Closed on
Nov 9, 2009
Sold by
Stincone Salvatore G and Stincone Maria R
Bought by
Panicker Mathai and Panicker Saramma
Home Financials for this Owner
Home Financials are based on the most recent Mortgage that was taken out on this home.
Original Mortgage
$292,000
Interest Rate
4.86%
Mortgage Type
Purchase Money Mortgage
Purchase Details
Closed on
Jul 16, 1997
Create a Home Valuation Report for This Property
The Home Valuation Report is an in-depth analysis detailing your home's value as well as a comparison with similar homes in the area
Home Values in the Area
Average Home Value in this Area
Purchase History
| Date | Buyer | Sale Price | Title Company |
|---|---|---|---|
| Singh Mukhwinder | $400,000 | -- | |
| Singh Mukhwinder | $400,000 | -- | |
| Singh Mukhwinder | $400,000 | -- | |
| Singh Mukhwinder | $400,000 | -- | |
| Singh Mukhwinder | $400,000 | -- | |
| Panicker Mathai | $365,000 | -- | |
| Panicker Mathai | $365,000 | -- | |
| Panicker Mathai | $365,000 | -- | |
| -- | -- | -- | |
| -- | -- | -- |
Source: Public Records
Mortgage History
| Date | Status | Borrower | Loan Amount |
|---|---|---|---|
| Open | Singh Mukhwinder | $260,000 | |
| Closed | Singh Mukhwinder | $260,000 | |
| Previous Owner | Panicker Mathai | $292,000 |
Source: Public Records
Tax History Compared to Growth
Tax History
| Year | Tax Paid | Tax Assessment Tax Assessment Total Assessment is a certain percentage of the fair market value that is determined by local assessors to be the total taxable value of land and additions on the property. | Land | Improvement |
|---|---|---|---|---|
| 2025 | $11,984 | $496 | $201 | $295 |
| 2024 | $4,058 | $503 | $204 | $299 |
| 2023 | $10,620 | $523 | $212 | $311 |
| 2022 | $10,620 | $523 | $212 | $311 |
| 2021 | $13,130 | $523 | $212 | $311 |
| 2020 | $12,441 | $593 | $529 | $64 |
| 2019 | $8,674 | $593 | $496 | $97 |
| 2017 | $5,246 | $672 | $410 | $262 |
| 2016 | $8,542 | $866 | $529 | $337 |
| 2015 | $3,947 | $866 | $529 | $337 |
| 2014 | $3,947 | $866 | $529 | $337 |
| 2013 | $3,700 | $866 | $529 | $337 |
Source: Public Records
Map
Nearby Homes