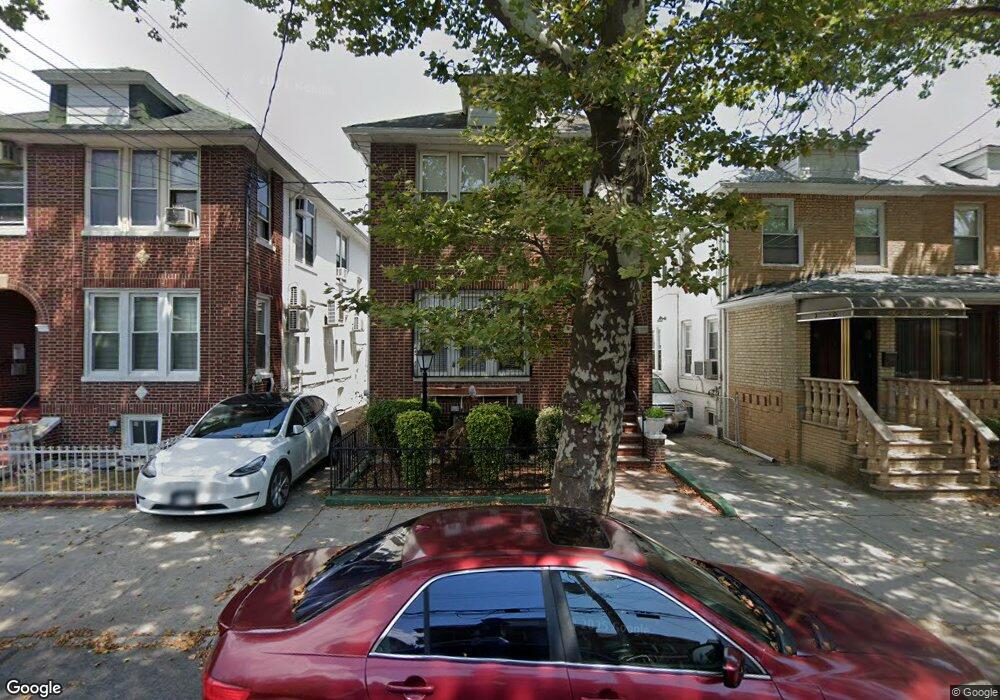
1335 E 36th St Brooklyn, NY 11234
Marine Park NeighborhoodEstimated Value: $1,022,000 - $1,139,970
Studio
--
Bath
2,480
Sq Ft
$444/Sq Ft
Est. Value
About This Home
This home is located at 1335 E 36th St, Brooklyn, NY 11234 and is currently estimated at $1,102,243, approximately $444 per square foot. 1335 E 36th St is a home located in Kings County with nearby schools including PS 222 Katherine R Snyder, J.H.S. 278 Marine Park, and Yeshivat Lev Torah.
Ownership History
Date
Name
Owned For
Owner Type
Purchase Details
Closed on
Mar 24, 2025
Sold by
Marshall-Jackson Carol
Bought by
Hines-Williams Maureen and Williams Elden R
Current Estimated Value
Purchase Details
Closed on
Jul 5, 2007
Sold by
Canberg Patricia and Endall Vivian
Bought by
Jackson Rudolph and Marshall Jackson Carol
Home Financials for this Owner
Home Financials are based on the most recent Mortgage that was taken out on this home.
Original Mortgage
$98,250
Interest Rate
6.54%
Purchase Details
Closed on
Feb 6, 2006
Sold by
Bertucelli John and Canberg Patricia
Bought by
Canberg Patricia and Endall Vivian
Purchase Details
Closed on
Jun 21, 1995
Sold by
Bertucelli John
Bought by
Canberg Patricia and Labarbera Joann
Create a Home Valuation Report for This Property
The Home Valuation Report is an in-depth analysis detailing your home's value as well as a comparison with similar homes in the area
Home Values in the Area
Average Home Value in this Area
Purchase History
| Date | Buyer | Sale Price | Title Company |
|---|---|---|---|
| Hines-Williams Maureen | -- | -- | |
| Jackson Rudolph | $655,000 | -- | |
| Jackson Rudolph | $655,000 | -- | |
| Canberg Patricia | -- | -- | |
| Canberg Patricia | -- | -- | |
| Canberg Patricia | -- | Commonwealth Land Title Ins | |
| Canberg Patricia | -- | Commonwealth Land Title Ins |
Source: Public Records
Mortgage History
| Date | Status | Borrower | Loan Amount |
|---|---|---|---|
| Previous Owner | Jackson Rudolph | $98,250 | |
| Previous Owner | Jackson Rudolph | $523,000 |
Source: Public Records
Tax History
| Year | Tax Paid | Tax Assessment Tax Assessment Total Assessment is a certain percentage of the fair market value that is determined by local assessors to be the total taxable value of land and additions on the property. | Land | Improvement |
|---|---|---|---|---|
| 2025 | $6,372 | $65,520 | $12,720 | $52,800 |
| 2024 | $6,372 | $63,480 | $12,720 | $50,760 |
| 2023 | $6,063 | $55,860 | $12,720 | $43,140 |
| 2022 | $5,952 | $45,720 | $12,720 | $33,000 |
| 2021 | $6,231 | $50,160 | $12,720 | $37,440 |
| 2020 | $2,913 | $46,320 | $12,720 | $33,600 |
| 2019 | $5,482 | $46,320 | $12,720 | $33,600 |
| 2018 | $4,650 | $26,043 | $7,451 | $18,592 |
| 2017 | $4,663 | $26,043 | $8,977 | $17,066 |
| 2016 | $4,545 | $25,844 | $8,117 | $17,727 |
| 2015 | $2,525 | $24,382 | $9,296 | $15,086 |
| 2014 | $2,525 | $23,004 | $7,467 | $15,537 |
Source: Public Records
Map
Nearby Homes
- 1532 Kimball St
- 1443 E 35th St
- 1513 Kimball St
- 3524 Avenue M
- 3402 Kings Hwy
- 3710 Avenue P
- 3626 Kings Hwy
- 3626 Kings Hwy Unit 6C
- 1345 E 38th St
- 1632 E 38th St
- 1569 E 34th St
- 3222 Kings Hwy
- 1344 E 35th St
- 1649 E 37th St
- 1544 E 34th St
- 1638 E 36th St
- 1217 E 36th St
- 1523 E 33rd St
- 1628 Hendrickson St
- 3117 Kings Hwy
- 1331 E 36th St
- 1329 E 36th St
- 1325 E 36th St
- 1339 E 36th St
- 1341 E 36th St
- 1323 E 36th St
- 1343 E 36th St
- 1319 E 36th St
- 1490 E 37th St
- 1488 E 37th St
- 1494 E 37th St
- 1484 E 37th St
- 1504 E 37th St
- 1347 E 36th St
- 1317 E 36th St
- 1482 E 37th St
- 3623 Flatlands Ave
- 1478 E 37th St
- 3619 Flatlands Ave
- 3625 Flatlands Ave
Your Personal Tour Guide
Ask me questions while you tour the home.