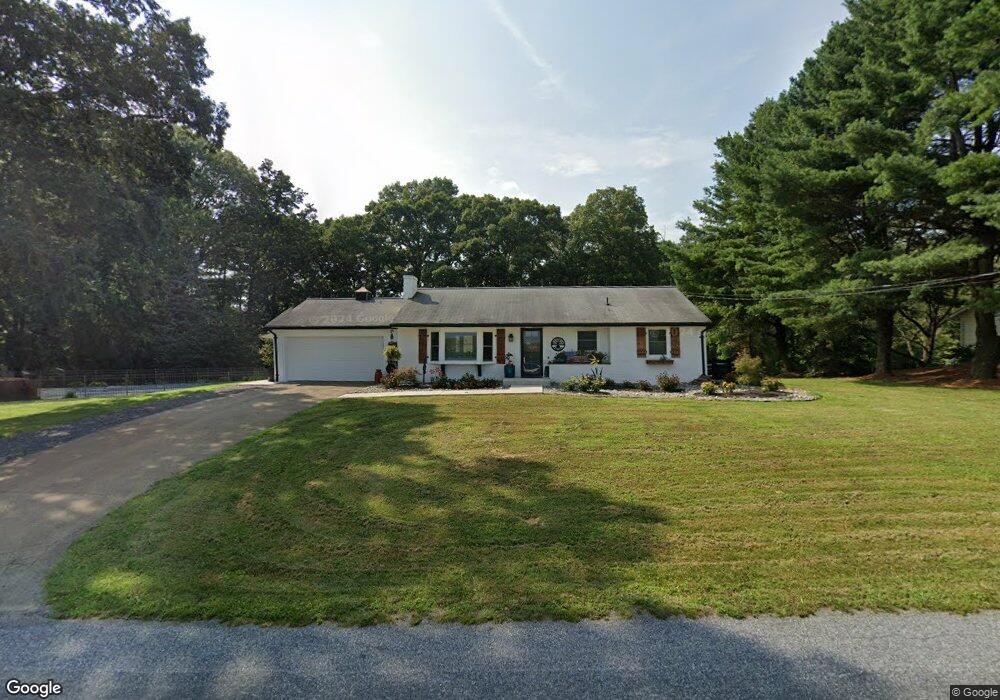
1335 Harmony Ridge Rd Peach Bottom, PA 17563
Estimated Value: $378,320 - $399,000
3
Beds
2
Baths
1,650
Sq Ft
$235/Sq Ft
Est. Value
About This Home
This home is located at 1335 Harmony Ridge Rd, Peach Bottom, PA 17563 and is currently estimated at $388,080, approximately $235 per square foot. 1335 Harmony Ridge Rd is a home located in Lancaster County with nearby schools including Smith Middle School and Solanco High School.
Ownership History
Date
Name
Owned For
Owner Type
Purchase Details
Closed on
Jul 26, 2024
Sold by
Gary A Margoline A and Gary Louise W
Bought by
Smith Jason K and Smith Heather
Current Estimated Value
Home Financials for this Owner
Home Financials are based on the most recent Mortgage that was taken out on this home.
Original Mortgage
$354,050
Outstanding Balance
$350,105
Interest Rate
6.95%
Mortgage Type
New Conventional
Estimated Equity
$37,975
Purchase Details
Closed on
Jan 24, 2014
Sold by
Margoline Gary A and Margoline Louise W
Bought by
The Gary A Margoline And Louise W Margol and Margoline Louise W
Purchase Details
Closed on
Nov 1, 2013
Sold by
Donnell Ryan John O and Donnell Valerie Ann O
Bought by
Margoline Gary A and Margoline Louise W
Purchase Details
Closed on
Oct 9, 2006
Sold by
Cutler Karen J and Nye Karen J
Bought by
Nye Daniel and Nye Karen J
Purchase Details
Closed on
Jun 30, 2000
Sold by
Cutler Karen J and Cutler Ronald W
Bought by
Cutler Karen J
Create a Home Valuation Report for This Property
The Home Valuation Report is an in-depth analysis detailing your home's value as well as a comparison with similar homes in the area
Home Values in the Area
Average Home Value in this Area
Purchase History
| Date | Buyer | Sale Price | Title Company |
|---|---|---|---|
| Smith Jason K | $365,000 | Chesco Settlement Services | |
| The Gary A Margoline And Louise W Margol | -- | None Available | |
| Margoline Gary A | $210,000 | None Available | |
| Nye Daniel | -- | None Available | |
| Cutler Karen J | -- | -- |
Source: Public Records
Mortgage History
| Date | Status | Borrower | Loan Amount |
|---|---|---|---|
| Open | Smith Jason K | $354,050 |
Source: Public Records
Tax History Compared to Growth
Tax History
| Year | Tax Paid | Tax Assessment Tax Assessment Total Assessment is a certain percentage of the fair market value that is determined by local assessors to be the total taxable value of land and additions on the property. | Land | Improvement |
|---|---|---|---|---|
| 2025 | $3,033 | $188,600 | $65,700 | $122,900 |
| 2024 | $3,033 | $188,600 | $65,700 | $122,900 |
| 2023 | $2,944 | $188,600 | $65,700 | $122,900 |
| 2022 | $2,848 | $188,600 | $65,700 | $122,900 |
| 2021 | $2,750 | $188,600 | $65,700 | $122,900 |
| 2020 | $2,750 | $188,600 | $65,700 | $122,900 |
| 2019 | $2,681 | $188,600 | $65,700 | $122,900 |
| 2018 | $3,125 | $188,600 | $65,700 | $122,900 |
| 2017 | $2,621 | $152,500 | $38,500 | $114,000 |
| 2016 | $2,621 | $152,500 | $38,500 | $114,000 |
| 2015 | $722 | $152,500 | $38,500 | $114,000 |
| 2014 | $1,800 | $152,500 | $38,500 | $114,000 |
Source: Public Records
Map
Nearby Homes
- 1534 Benton Hollow Rd
- 2143 Bald Eagle Rd
- 121 Black Bear Rd
- 2 Anthony Ct
- 3 Anthony Ct
- 866 Quarry Rd
- 44 Oak Ridge Dr
- 603 Poplar Ln
- 117 Grove Rd
- 293 Grove Rd
- 1109 Susquehannock Dr
- 0 Nottingham Rd
- 440 Scotland Rd
- 523 River Rd
- 220 Clearview Dr
- 999 Hilldale Rd
- 0 Little Britain Rd N Unit PALA2061636
- 574 Cinder Rd
- 225 Cedar Hill Rd
- 0 Buck Heights Rd
- 1329 Harmony Ridge Rd
- 1318 Harmony Ridge Rd Unit 4
- 1316 Harmony Ridge Rd
- 1320 Harmony Ridge Rd
- 1317 Harmony Ridge Rd
- 1326 Harmony Ridge Rd
- 1302 Harmony Ridge Rd
- 1421 Slate Hill Rd
- 1331 Harmony Ridge Rd
- 1335 Harmony Ridge Rd
- 1423 Slate Hill Rd
- 1341 Slate Hill Rd
- 1425 Slate Hill Rd
- 1337 Harmony Ridge Rd
- 1427 Slate Hill Rd
- 1335 Slate Hill Rd
- 1429 Slate Hill Rd
- 1428 Slate Hill Rd
- 1333 Slate Hill Rd
- 1331 Slate Hill Rd