
Seller's Agent in 2025
David De Leeuw
Keller Williams Realty
(925) 817-7808
1 in this area
36 Total Sales
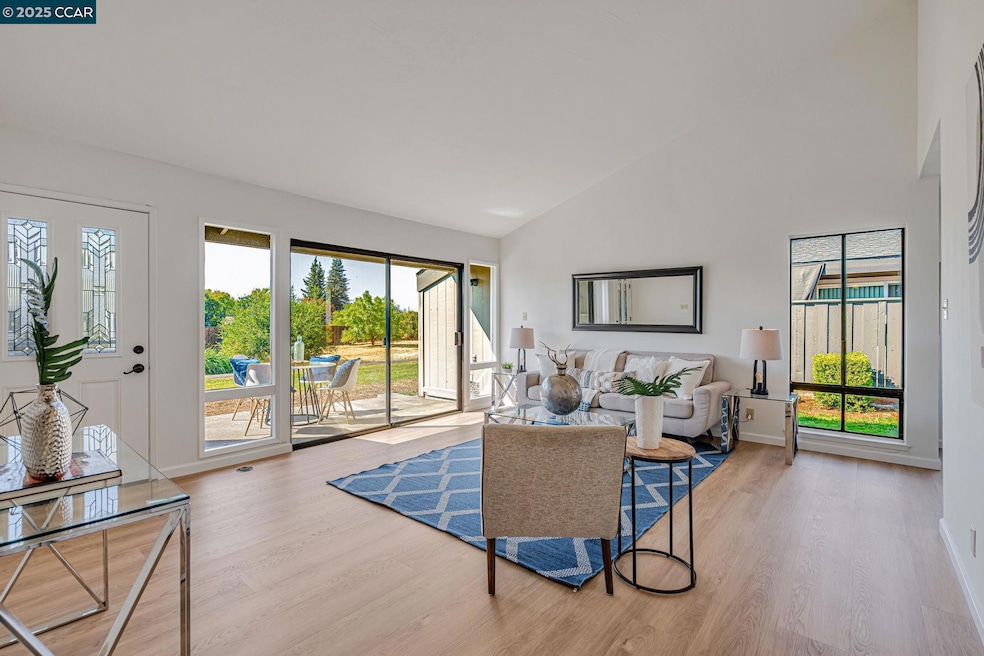
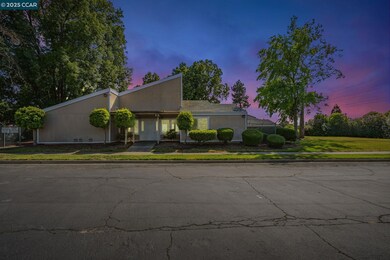
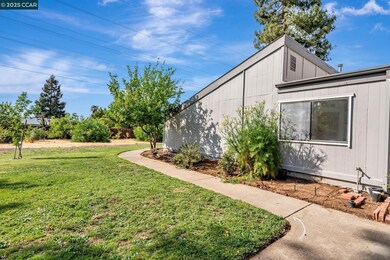
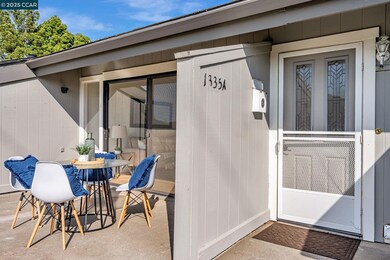
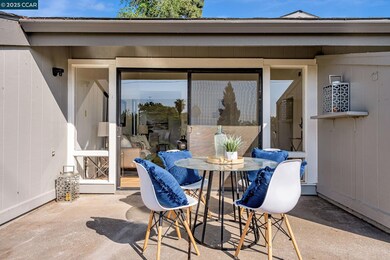
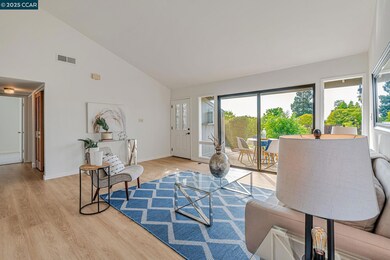
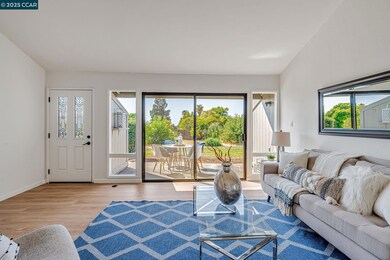
Wow! A one story end-unit townhouse in a very convenient location. Arguably the best view location in the development. Freshly painted. New floors - Carpet in bedrooms and beautiful low-maintenance Luxury Vinyl Plank (LVP) throughout the rest of the home! Perfectly near yet not too close to the clubhouse and sparkling swimming pool. Near shopping centers, close to area hospitals. Perfect starter home - or - for downsizing. Newer range and under-sink garbage disposer. Minutes to downtown Walnut Creek, and downtown Concord, walking trails, schools..
Last Agent to Sell the Property
Keller Williams Realty License #02074268 Listed on: 06/08/2025
| Date | Type | Sale Price | Title Company |
|---|---|---|---|
| Grant Deed | $390,000 | Chicago Title | |
| Interfamily Deed Transfer | -- | Placer Title Company | |
| Interfamily Deed Transfer | -- | -- | |
| Grant Deed | $119,500 | Alliance Title Company |
| Date | Status | Loan Amount | Loan Type |
|---|---|---|---|
| Open | $292,500 | New Conventional | |
| Previous Owner | $258,750 | Purchase Money Mortgage | |
| Previous Owner | $113,600 | Purchase Money Mortgage |
| Date | Event | Price | List to Sale | Price per Sq Ft |
|---|---|---|---|---|
| 07/31/2025 07/31/25 | Sold | $390,000 | +0.8% | $426 / Sq Ft |
| 06/18/2025 06/18/25 | Pending | -- | -- | -- |
| 06/08/2025 06/08/25 | For Sale | $387,000 | -- | $423 / Sq Ft |
| Year | Tax Paid | Tax Assessment Tax Assessment Total Assessment is a certain percentage of the fair market value that is determined by local assessors to be the total taxable value of land and additions on the property. | Land | Improvement |
|---|---|---|---|---|
| 2025 | $2,949 | $183,795 | $55,316 | $128,479 |
| 2024 | $2,856 | $180,192 | $54,232 | $125,960 |
| 2023 | $2,781 | $176,660 | $53,169 | $123,491 |
| 2022 | $2,718 | $173,197 | $52,127 | $121,070 |
| 2021 | $2,632 | $169,802 | $51,105 | $118,697 |
| 2019 | $2,565 | $164,767 | $49,590 | $115,177 |
| 2018 | $2,455 | $161,537 | $48,618 | $112,919 |
| 2017 | $2,356 | $158,370 | $47,665 | $110,705 |
| 2016 | $2,263 | $155,266 | $46,731 | $108,535 |
| 2015 | $2,206 | $152,935 | $46,030 | $106,905 |
| 2014 | $2,138 | $149,940 | $45,129 | $104,811 |
Seller's Agent in 2025
David De Leeuw
Keller Williams Realty
(925) 817-7808
1 in this area
36 Total Sales
C
Buyer's Agent in 2025
Christian Calingo
Exp Realty of California Inc.
(707) 746-8700
1 in this area
11 Total Sales
Source: Contra Costa Association of REALTORS®
MLS Number: 41096819
APN: 120-341-067-3
Disclaimer: Certain information contained herein is derived from information provided by parties other than Homes.com. All information provided is deemed reliable, but is not guaranteed to be accurate and should be independently verified.
![]() Bay East ©2026. BridgeMLS ©2026, CCAR ©2026. Information Deemed Reliable But Not Guaranteed. This information is being provided by the Bay East MLS, BridgeMLS or CCAR MLS. The listings presented here may or may not be listed by the Broker/Agent operating this website. This information is intended for the personal use of consumers, and may not be used for any purpose other than to identify prospective properties consumers may be interested in purchasing.
Bay East ©2026. BridgeMLS ©2026, CCAR ©2026. Information Deemed Reliable But Not Guaranteed. This information is being provided by the Bay East MLS, BridgeMLS or CCAR MLS. The listings presented here may or may not be listed by the Broker/Agent operating this website. This information is intended for the personal use of consumers, and may not be used for any purpose other than to identify prospective properties consumers may be interested in purchasing.
Ask me questions while you tour the home.