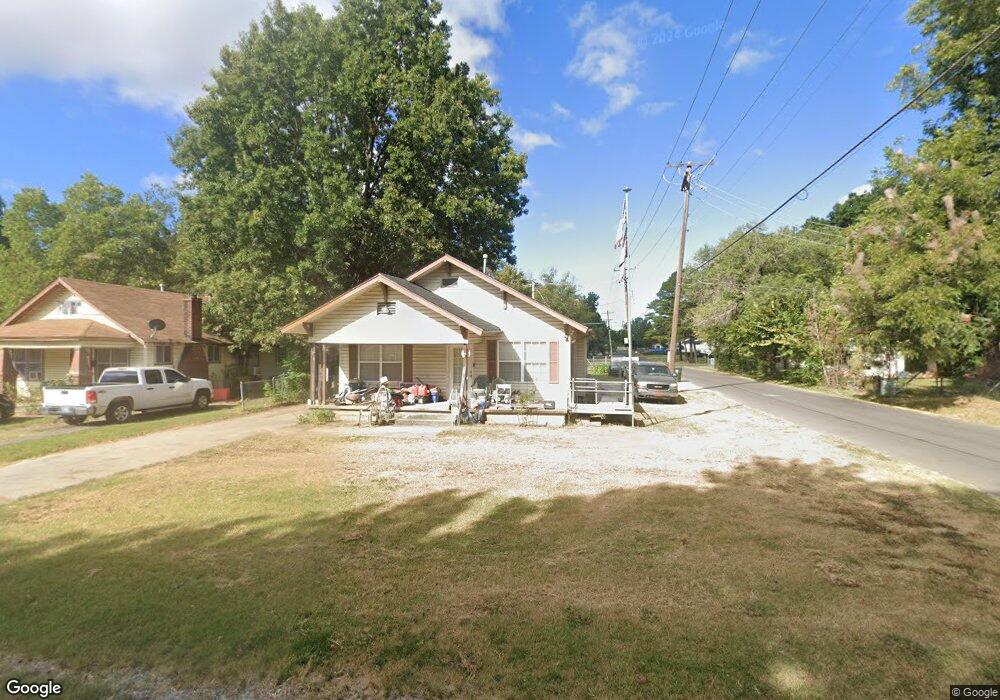
1335 Locust St Muskogee, OK 74403
Central Muskogee NeighborhoodEstimated Value: $67,000 - $116,000
2
Beds
2
Baths
1,156
Sq Ft
$71/Sq Ft
Est. Value
About This Home
This home is located at 1335 Locust St, Muskogee, OK 74403 and is currently estimated at $82,283, approximately $71 per square foot. 1335 Locust St is a home located in Muskogee County with nearby schools including Irving Elementary School, 8th & 9th Grade Academy @ Alice Robertson, and Muskogee High School.
Ownership History
Date
Name
Owned For
Owner Type
Purchase Details
Closed on
Jun 29, 2007
Sold by
Hicken S Stephannie
Bought by
Sanchez Jesse L
Current Estimated Value
Home Financials for this Owner
Home Financials are based on the most recent Mortgage that was taken out on this home.
Original Mortgage
$13,500
Interest Rate
6.19%
Mortgage Type
Purchase Money Mortgage
Purchase Details
Closed on
May 18, 1998
Bought by
Sanchez Jesse L
Purchase Details
Closed on
Feb 5, 1997
Purchase Details
Closed on
Sep 27, 1996
Purchase Details
Closed on
Jun 14, 1996
Create a Home Valuation Report for This Property
The Home Valuation Report is an in-depth analysis detailing your home's value as well as a comparison with similar homes in the area
Home Values in the Area
Average Home Value in this Area
Purchase History
| Date | Buyer | Sale Price | Title Company |
|---|---|---|---|
| Sanchez Jesse L | $15,000 | None Available | |
| Sanchez Jesse L | $46,000 | -- | |
| -- | $34,500 | -- | |
| -- | $12,000 | -- | |
| -- | -- | -- |
Source: Public Records
Mortgage History
| Date | Status | Borrower | Loan Amount |
|---|---|---|---|
| Closed | Sanchez Jesse L | $13,500 |
Source: Public Records
Tax History Compared to Growth
Tax History
| Year | Tax Paid | Tax Assessment Tax Assessment Total Assessment is a certain percentage of the fair market value that is determined by local assessors to be the total taxable value of land and additions on the property. | Land | Improvement |
|---|---|---|---|---|
| 2024 | $280 | $3,571 | $385 | $3,186 |
| 2023 | $280 | $4,165 | $364 | $3,801 |
| 2022 | $292 | $4,043 | $352 | $3,691 |
| 2021 | $281 | $3,811 | $330 | $3,481 |
| 2020 | $282 | $3,811 | $330 | $3,481 |
| 2019 | $280 | $3,812 | $330 | $3,482 |
| 2018 | $264 | $3,812 | $330 | $3,482 |
| 2017 | $245 | $3,600 | $330 | $3,270 |
| 2016 | $238 | $3,495 | $330 | $3,165 |
| 2015 | $235 | $3,495 | $330 | $3,165 |
| 2014 | $240 | $3,495 | $330 | $3,165 |
Source: Public Records
Map
Nearby Homes