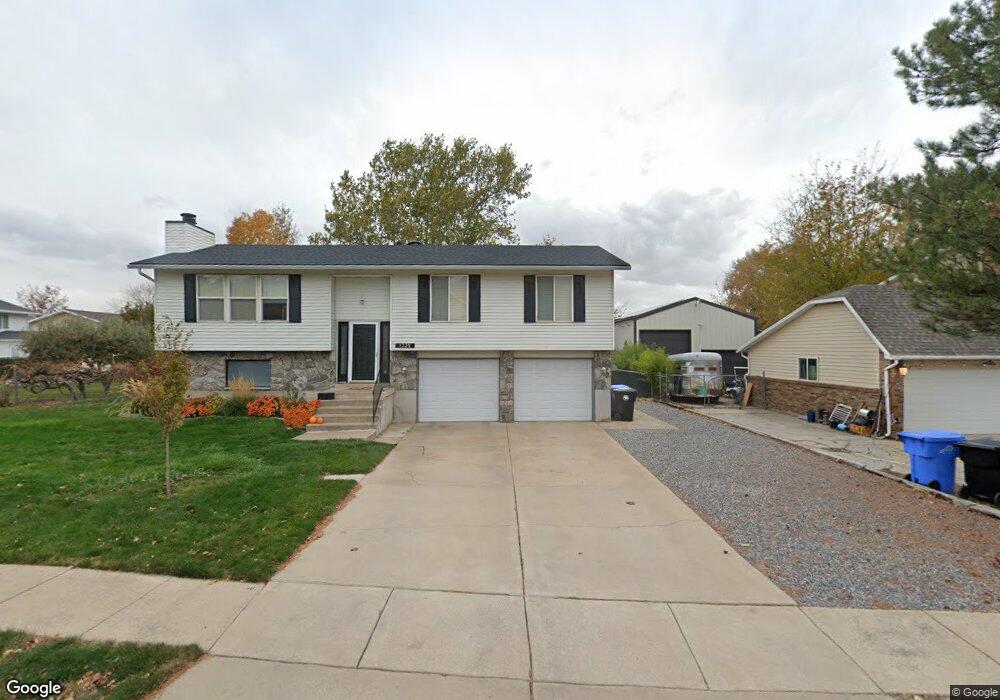
1335 N 640 W West Bountiful, UT 84087
Estimated Value: $491,000 - $511,000
3
Beds
3
Baths
1,931
Sq Ft
$260/Sq Ft
Est. Value
About This Home
This home is located at 1335 N 640 W, West Bountiful, UT 84087 and is currently estimated at $501,345, approximately $259 per square foot. 1335 N 640 W is a home located in Davis County with nearby schools including West Bountiful Elementary School, Bountiful Junior High School, and Viewmont High School.
Ownership History
Date
Name
Owned For
Owner Type
Purchase Details
Closed on
Nov 18, 2016
Sold by
Landgren Tyler
Bought by
Landgren Tyler and Landgren Katie
Current Estimated Value
Purchase Details
Closed on
Mar 13, 2009
Sold by
Cox Christopher G and Cox Sarah
Bought by
Cox Christopher and Cox Sarah
Home Financials for this Owner
Home Financials are based on the most recent Mortgage that was taken out on this home.
Original Mortgage
$218,000
Interest Rate
5.19%
Mortgage Type
New Conventional
Purchase Details
Closed on
Nov 7, 2007
Sold by
Acord Newell C
Bought by
Cox Christopher G and Cox Sarah
Home Financials for this Owner
Home Financials are based on the most recent Mortgage that was taken out on this home.
Original Mortgage
$210,000
Interest Rate
6.4%
Mortgage Type
Purchase Money Mortgage
Create a Home Valuation Report for This Property
The Home Valuation Report is an in-depth analysis detailing your home's value as well as a comparison with similar homes in the area
Home Values in the Area
Average Home Value in this Area
Purchase History
| Date | Buyer | Sale Price | Title Company |
|---|---|---|---|
| Landgren Tyler | -- | Guarantee Title | |
| Landgren Tyler | -- | None Available | |
| Cox Christopher | -- | First American Title | |
| Cox Christopher G | -- | First American Title |
Source: Public Records
Mortgage History
| Date | Status | Borrower | Loan Amount |
|---|---|---|---|
| Previous Owner | Cox Christopher | $218,000 | |
| Previous Owner | Cox Christopher G | $210,000 |
Source: Public Records
Tax History Compared to Growth
Tax History
| Year | Tax Paid | Tax Assessment Tax Assessment Total Assessment is a certain percentage of the fair market value that is determined by local assessors to be the total taxable value of land and additions on the property. | Land | Improvement |
|---|---|---|---|---|
| 2025 | $2,706 | $235,951 | $140,498 | $95,453 |
| 2024 | $2,545 | $227,150 | $115,548 | $111,602 |
| 2023 | $2,276 | $371,000 | $218,488 | $152,512 |
| 2022 | $2,330 | $212,851 | $104,880 | $107,971 |
| 2021 | $2,192 | $308,000 | $141,634 | $166,366 |
| 2020 | $2,005 | $279,000 | $131,298 | $147,702 |
| 2019 | $1,973 | $272,000 | $132,384 | $139,616 |
| 2018 | $1,846 | $251,000 | $132,429 | $118,571 |
| 2016 | $1,565 | $115,335 | $34,845 | $80,490 |
| 2015 | $1,501 | $105,050 | $34,845 | $70,205 |
| 2014 | $1,718 | $124,084 | $34,480 | $89,604 |
| 2013 | -- | $102,155 | $31,271 | $70,884 |
Source: Public Records
Map
Nearby Homes
- 637 W 1600 N
- 825 W 1320 N
- Lincoln Farmhouse Plan at Belmont Farms
- Belmont Traditional Plan at Belmont Farms
- Hampton Traditional Plan at Belmont Farms
- 366 W 1000 N
- 1503 N 300 W
- 790 N 500 W
- 789 W 1950 N
- 235 W 1400 N
- 1410 N 200 W
- 1194 N 200 W
- 580 W 2125 N
- 1552 N 200 W
- 1260 N 200 W
- 2035 N 800 W
- 239 Lyman Ln
- 234 Leah Cir
- 204 Lyman Ln
- 548 S 675 W