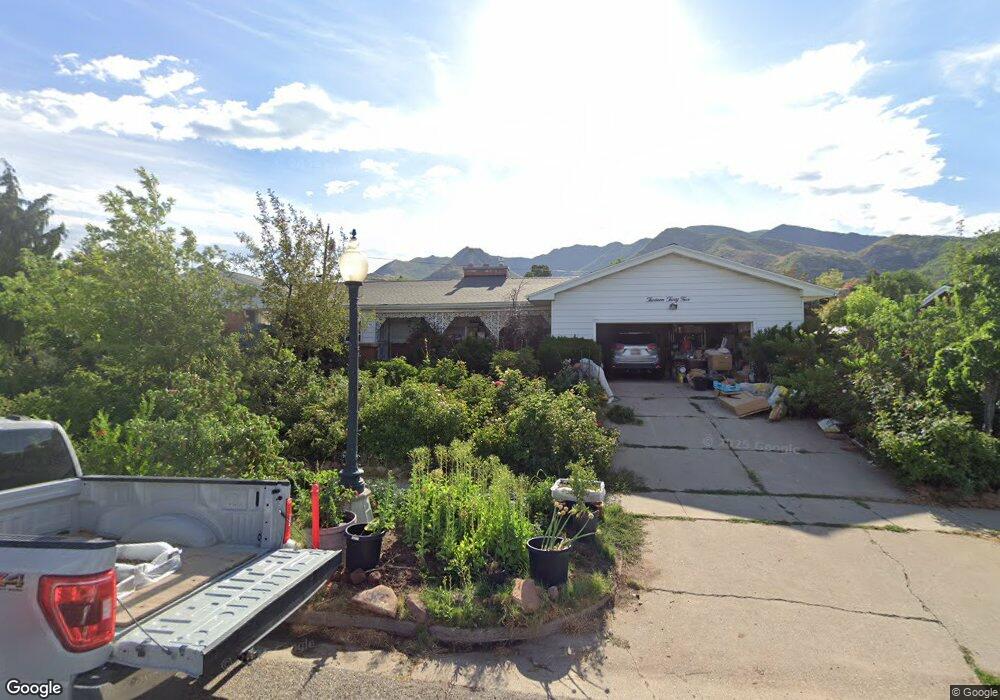
1335 S Wasatch Dr Salt Lake City, UT 84108
East Bench NeighborhoodEstimated Value: $1,253,000 - $1,424,872
5
Beds
3
Baths
4,442
Sq Ft
$299/Sq Ft
Est. Value
About This Home
This home is located at 1335 S Wasatch Dr, Salt Lake City, UT 84108 and is currently estimated at $1,327,624, approximately $298 per square foot. 1335 S Wasatch Dr is a home located in Salt Lake County with nearby schools including Indian Hills Elementary School, Hillside Middle School, and Highland High School.
Ownership History
Date
Name
Owned For
Owner Type
Purchase Details
Closed on
Oct 16, 2017
Sold by
Allen Irvin K
Bought by
Allen Irvin K and Allen Karin G
Current Estimated Value
Purchase Details
Closed on
May 24, 2012
Sold by
Homer Robert W
Bought by
Zou Juunuang and Zou Welping
Purchase Details
Closed on
Mar 9, 2009
Sold by
Homer Louie M
Bought by
Homer Louie M and The Louie M Homer Trust
Home Financials for this Owner
Home Financials are based on the most recent Mortgage that was taken out on this home.
Original Mortgage
$792,000
Interest Rate
3.47%
Mortgage Type
Reverse Mortgage Home Equity Conversion Mortgage
Purchase Details
Closed on
Jul 15, 2004
Sold by
Homer Louie M
Bought by
Homer Louie M and Louie M Homer Trust
Purchase Details
Closed on
Mar 15, 1996
Sold by
Homer Louie M
Bought by
Homer Robert W
Purchase Details
Closed on
Jan 27, 1995
Sold by
Anderson Michiel M and Anderson Shirley I
Bought by
Anderson Carl W and Anderson Celestia
Create a Home Valuation Report for This Property
The Home Valuation Report is an in-depth analysis detailing your home's value as well as a comparison with similar homes in the area
Home Values in the Area
Average Home Value in this Area
Purchase History
| Date | Buyer | Sale Price | Title Company |
|---|---|---|---|
| Allen Irvin K | -- | Premium Title & Escrow | |
| Zou Juunuang | -- | Red Rock Title Ins Agcy Llc | |
| Homer Louie M | -- | 1St National Title Ins Agenc | |
| Homer Louie M | -- | Cpr Title Ins Agency | |
| Homer Robert W | -- | -- | |
| Anderson Carl W | -- | -- |
Source: Public Records
Mortgage History
| Date | Status | Borrower | Loan Amount |
|---|---|---|---|
| Previous Owner | Homer Louie M | $792,000 |
Source: Public Records
Tax History Compared to Growth
Tax History
| Year | Tax Paid | Tax Assessment Tax Assessment Total Assessment is a certain percentage of the fair market value that is determined by local assessors to be the total taxable value of land and additions on the property. | Land | Improvement |
|---|---|---|---|---|
| 2025 | $5,134 | $1,054,100 | $333,500 | $720,600 |
| 2024 | $5,134 | $979,600 | $318,300 | $661,300 |
| 2023 | $4,937 | $908,000 | $306,100 | $601,900 |
| 2022 | $5,385 | $929,200 | $300,000 | $629,200 |
| 2021 | $4,784 | $747,400 | $244,200 | $503,200 |
| 2020 | $4,843 | $720,100 | $228,200 | $491,900 |
| 2019 | $4,298 | $601,300 | $218,500 | $382,800 |
| 2018 | $3,972 | $541,200 | $218,500 | $322,700 |
| 2017 | $4,019 | $513,000 | $218,500 | $294,500 |
| 2016 | $4,063 | $492,500 | $218,500 | $274,000 |
| 2015 | $3,852 | $442,500 | $214,100 | $228,400 |
| 2014 | $3,739 | $426,100 | $214,100 | $212,000 |
Source: Public Records
Map
Nearby Homes
- 1444 Beacon Dr
- 1502 S 2400 E
- 2266 E Kensington Ave
- 1182 S Foothill Dr Unit 511
- 1170 S Foothill Dr Unit 311
- 2366 Logan Ave S
- 2618 E Skyline Dr
- 2326 E 1700 S
- 2662 E Comanche Dr
- 1423 S Ambassador Way
- 2726 E Wasatch Dr Unit 18
- 2777 E Comanche Dr
- 2259 E Hubbard Ave
- 1769 S Foothill Dr
- 855 S Woodruff Way
- 2125 Logan Ave S
- 1458 S Wilton Way
- 2008 E Laird Dr
- 2842 E Oakbrook Cir
- 1802 S Wasatch Dr
- 1335 Wasatch Dr
- 2589 Village Cir
- 1345 Wasatch Dr
- 1327 Wasatch Dr
- 1345 S Wasatch Dr
- 2454 Village Cir
- 2579 Village Cir
- 1351 Wasatch Dr
- 1351 S Wasatch Dr
- 2569 E Village Cir
- 2569 Village Cir
- 2588 Village Cir
- 1315 Wasatch Dr
- 2474 E Village Cir
- 2474 Village Cir
- 1365 Wasatch Dr
- 1365 S Wasatch Dr
- 2455 E Village Cir
- 2455 Village Cir
- 2564 Village Cir