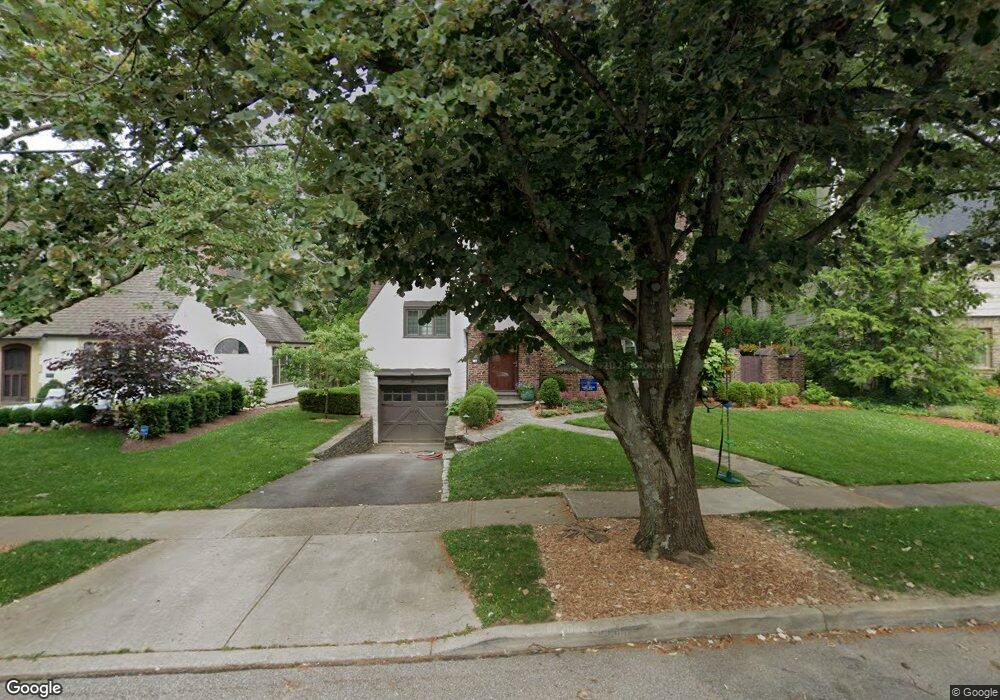
1335 Suncrest Dr Cincinnati, OH 45208
Mount Lookout NeighborhoodEstimated Value: $1,074,000 - $1,422,000
3
Beds
5
Baths
4,440
Sq Ft
$269/Sq Ft
Est. Value
About This Home
This home is located at 1335 Suncrest Dr, Cincinnati, OH 45208 and is currently estimated at $1,195,450, approximately $269 per square foot. 1335 Suncrest Dr is a home located in Hamilton County with nearby schools including Kilgour Elementary School, Clark Montessori High School, and Shroder High School.
Ownership History
Date
Name
Owned For
Owner Type
Purchase Details
Closed on
Dec 18, 2011
Sold by
Mccarthy Timothy J and Mccarthy Cynthia J
Bought by
Boehm Kurt J and Boehm Lauren
Current Estimated Value
Home Financials for this Owner
Home Financials are based on the most recent Mortgage that was taken out on this home.
Original Mortgage
$417,000
Outstanding Balance
$281,214
Interest Rate
4.02%
Mortgage Type
New Conventional
Estimated Equity
$914,236
Purchase Details
Closed on
Aug 1, 2007
Sold by
Knecht Paula Ann and Knecht William C
Bought by
Mccarthy Timothy J and Mccarthy Cynthia J
Home Financials for this Owner
Home Financials are based on the most recent Mortgage that was taken out on this home.
Original Mortgage
$150,000
Interest Rate
6.71%
Mortgage Type
Unknown
Purchase Details
Closed on
Aug 4, 2000
Sold by
Knecht William C and Knecht Paula Ann
Bought by
Knecht William C and Knecht Paula Ann
Create a Home Valuation Report for This Property
The Home Valuation Report is an in-depth analysis detailing your home's value as well as a comparison with similar homes in the area
Home Values in the Area
Average Home Value in this Area
Purchase History
| Date | Buyer | Sale Price | Title Company |
|---|---|---|---|
| Boehm Kurt J | $613,000 | Attorney | |
| Mccarthy Timothy J | -- | Ltoc | |
| Knecht William C | -- | -- |
Source: Public Records
Mortgage History
| Date | Status | Borrower | Loan Amount |
|---|---|---|---|
| Open | Boehm Kurt J | $417,000 | |
| Closed | Mccarthy Timothy J | $150,000 |
Source: Public Records
Tax History
| Year | Tax Paid | Tax Assessment Tax Assessment Total Assessment is a certain percentage of the fair market value that is determined by local assessors to be the total taxable value of land and additions on the property. | Land | Improvement |
|---|---|---|---|---|
| 2025 | $14,449 | $234,843 | $77,182 | $157,661 |
| 2024 | $14,136 | $234,843 | $77,182 | $157,661 |
| 2023 | $14,326 | $234,843 | $77,182 | $157,661 |
| 2022 | $15,439 | $227,049 | $68,121 | $158,928 |
| 2021 | $14,864 | $227,049 | $68,121 | $158,928 |
| 2020 | $15,301 | $227,049 | $68,121 | $158,928 |
| 2019 | $14,296 | $194,058 | $58,223 | $135,835 |
| 2018 | $14,318 | $194,058 | $58,223 | $135,835 |
| 2017 | $13,642 | $194,058 | $58,223 | $135,835 |
| 2016 | $15,290 | $214,551 | $54,730 | $159,821 |
| 2015 | $13,787 | $214,551 | $54,730 | $159,821 |
| 2014 | $13,845 | $214,551 | $54,730 | $159,821 |
| 2013 | $11,003 | $167,546 | $49,305 | $118,241 |
Source: Public Records
Map
Nearby Homes
- 1338 Suncrest Dr
- 1344 Delta Ave
- 3443 Ault View Ave
- 1225 Corbett St
- 3509 Tarpis Ave
- 3059 Griest Ave
- 3517 Tarpis Ave
- 3037 Griest Ave
- 1065 Delta Ave
- 3613 Herschel Ave
- 3008 Erie Ave
- 1231 Grace Ave
- 2922 Utopia Place
- 3109 Linwood Ave
- 1346 Herlin Place
- 3649 Herschel Ave
- 3635 Ault Park Ave
- 1134 Beverly Hill Dr
- 3300 Linwood Ave
- 1106 Priscilla Ln
- 1339 Suncrest Dr
- 1331 Suncrest Dr
- 1330 Park Ridge Place
- 1334 Park Ridge Place
- 1334 Suncrest Dr
- 1327 Suncrest Dr
- 1326 Park Ridge Place
- 1323 Suncrest Dr
- 1338 Park Ridge Place
- 1343 Suncrest Dr
- 1322 Park Ridge Place
- 1336 Suncrest Dr
- 1326 Suncrest Dr
- 1342 Park Ridge Place
- 1319 Suncrest Dr
- 1351 Suncrest Dr
- 1322 Suncrest Dr
- 1355 Suncrest Dr
- 1318 Park Ridge Place
- 1315 Suncrest Dr
Your Personal Tour Guide
Ask me questions while you tour the home.