Estimated Value: $317,290 - $343,000
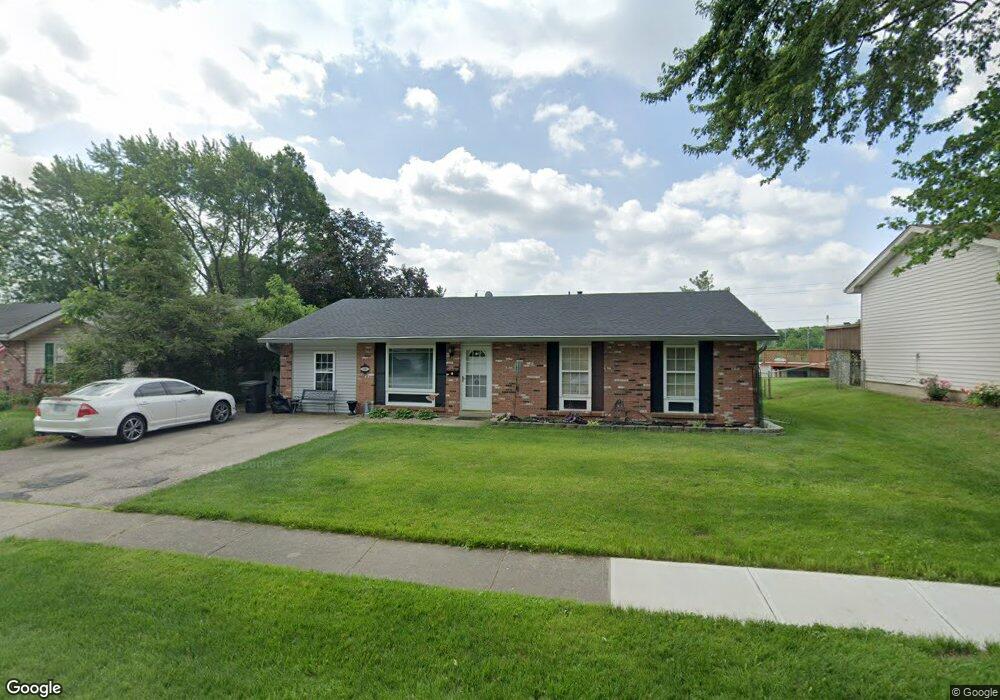
3
Beds
2
Baths
1,911
Sq Ft
$173/Sq Ft
Est. Value
About This Home
This home is located at 1335 Windward Dr, Mason, OH 45040 and is currently estimated at $331,323, approximately $173 per square foot. 1335 Windward Dr is a home located in Warren County with nearby schools including Mason Intermediate Elementary School, Mason Middle School, and William Mason High School.
Ownership History
Date
Name
Owned For
Owner Type
Purchase Details
Closed on
May 19, 2003
Sold by
Hughes James D and Hughes Bonnie K
Bought by
Sherman Judy P
Current Estimated Value
Home Financials for this Owner
Home Financials are based on the most recent Mortgage that was taken out on this home.
Original Mortgage
$135,000
Outstanding Balance
$67,280
Interest Rate
8.37%
Mortgage Type
Purchase Money Mortgage
Estimated Equity
$264,043
Purchase Details
Closed on
Mar 2, 1988
Sold by
Britton Britton and Britton Edward R
Bought by
Hughes Hughes and Hughes James D
Purchase Details
Closed on
Nov 4, 1987
Sold by
Britton Britton and Britton R. Edward
Bought by
Britton Britton and Britton Edward R
Purchase Details
Closed on
Nov 12, 1985
Sold by
Taylor Hershel H and Taylor Kare
Bought by
Britton and Edward R
Purchase Details
Closed on
Dec 29, 1978
Sold by
Dawson Dawson and Dawson James David
Create a Home Valuation Report for This Property
The Home Valuation Report is an in-depth analysis detailing your home's value as well as a comparison with similar homes in the area
Home Values in the Area
Average Home Value in this Area
Purchase History
| Date | Buyer | Sale Price | Title Company |
|---|---|---|---|
| Sherman Judy P | $132,000 | Southeast Equity Title Agenc | |
| Hughes Hughes | $57,000 | -- | |
| Britton Britton | -- | -- | |
| Britton | $55,500 | -- | |
| -- | $45,000 | -- |
Source: Public Records
Mortgage History
| Date | Status | Borrower | Loan Amount |
|---|---|---|---|
| Open | Sherman Judy P | $135,000 |
Source: Public Records
Tax History
| Year | Tax Paid | Tax Assessment Tax Assessment Total Assessment is a certain percentage of the fair market value that is determined by local assessors to be the total taxable value of land and additions on the property. | Land | Improvement |
|---|---|---|---|---|
| 2025 | $3,565 | $87,850 | $24,500 | $63,350 |
| 2024 | $3,565 | $87,850 | $24,500 | $63,350 |
| 2023 | $3,219 | $67,004 | $10,762 | $56,241 |
| 2022 | $3,177 | $67,004 | $10,763 | $56,242 |
| 2021 | $3,010 | $67,004 | $10,763 | $56,242 |
| 2020 | $2,854 | $54,474 | $8,750 | $45,724 |
| 2019 | $2,624 | $54,474 | $8,750 | $45,724 |
| 2018 | $2,632 | $54,474 | $8,750 | $45,724 |
| 2017 | $2,422 | $46,795 | $8,274 | $38,521 |
| 2016 | $2,460 | $46,134 | $8,274 | $37,860 |
| 2015 | $2,465 | $46,134 | $8,274 | $37,860 |
| 2014 | $2,470 | $43,110 | $7,730 | $35,380 |
| 2013 | $2,476 | $48,800 | $8,750 | $40,050 |
Source: Public Records
Map
Nearby Homes
- 792 Majken Place
- 899 Tradewind Dr
- 1475 St Lawrence Dr
- 968 Olympia Dr
- 1041 Sheffield Dr
- 6300 Amber Ct
- 8335 Charming Manor
- 6404 Coverage Ct
- 6394 Coverage Ct
- 6382 Coverage Ct
- 6411 Coverage Ct
- 6378 Coverage Ct
- 6364 Coverage Ct
- 6354 Coverage Ct
- 6403 Nicholas Way
- 6393 Nicholas Way
- 6179 Nicholas Way
- 6358 Coverage Ct
- 6175 Nicholas Way
- 6379 Coverage Ct
- 1327 Windward Dr
- 1343 Windward Dr
- 1353 Windward Dr
- 1315 Windward Dr
- 1336 Windward Dr
- 1361 Windward Dr
- 1326 Windward Dr
- 1344 Windward Dr
- 1311 Anthony Ln
- 1316 Windward Dr
- 1356 Windward Dr
- 1371 Windward Dr
- 1307 Anthony Ln
- 1364 Windward Dr
- 1321 Jennings Ct
- 1303 Anthony Ln
- 1325 Jennings Ct
- 1312 Anthony Ln
- 1329 Jennings Ct
- 1379 Windward Dr
Your Personal Tour Guide
Ask me questions while you tour the home.