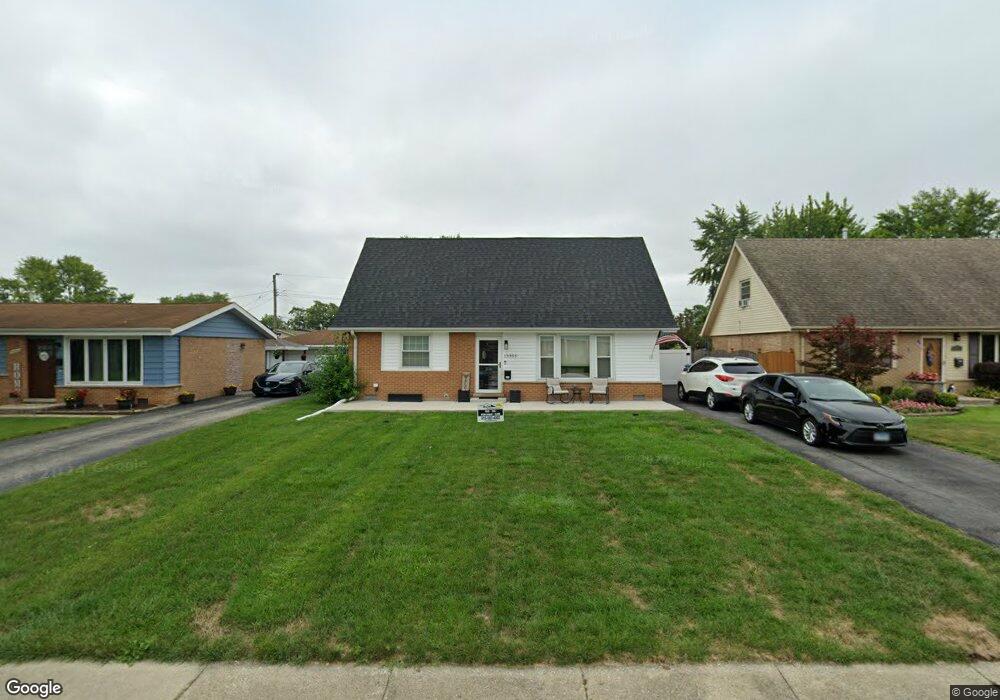
13353 S End Ln Crestwood, IL 60445
Estimated Value: $273,643 - $302,000
4
Beds
1
Bath
1,498
Sq Ft
$194/Sq Ft
Est. Value
About This Home
This home is located at 13353 S End Ln, Crestwood, IL 60445 and is currently estimated at $291,161, approximately $194 per square foot. 13353 S End Ln is a home located in Cook County with nearby schools including Nathan Hale Primary School, Nathan Hale Intermediate School, and Nathan Hale Middle School.
Ownership History
Date
Name
Owned For
Owner Type
Purchase Details
Closed on
Apr 28, 2011
Sold by
Smith Rodney D and Smith Lynn M
Bought by
Tellado Ruben and Tellado Kim M
Current Estimated Value
Home Financials for this Owner
Home Financials are based on the most recent Mortgage that was taken out on this home.
Original Mortgage
$158,720
Outstanding Balance
$110,303
Interest Rate
4.88%
Mortgage Type
VA
Estimated Equity
$180,858
Purchase Details
Closed on
Dec 26, 2008
Sold by
Smith Rodney D and Randecker Lynn M
Bought by
Smith Rodney D and Smith Lynn M
Home Financials for this Owner
Home Financials are based on the most recent Mortgage that was taken out on this home.
Original Mortgage
$194,880
Interest Rate
5.96%
Mortgage Type
FHA
Purchase Details
Closed on
Aug 1, 2006
Sold by
Kuchan Sharon C
Bought by
Smith Rodney D and Randecker Lynn M
Home Financials for this Owner
Home Financials are based on the most recent Mortgage that was taken out on this home.
Original Mortgage
$159,900
Interest Rate
6%
Mortgage Type
Unknown
Create a Home Valuation Report for This Property
The Home Valuation Report is an in-depth analysis detailing your home's value as well as a comparison with similar homes in the area
Home Values in the Area
Average Home Value in this Area
Purchase History
| Date | Buyer | Sale Price | Title Company |
|---|---|---|---|
| Tellado Ruben | $155,000 | Chicago Title Insurance Co | |
| Smith Rodney D | -- | K&M Title Llc | |
| Smith Rodney D | $200,000 | Multiple |
Source: Public Records
Mortgage History
| Date | Status | Borrower | Loan Amount |
|---|---|---|---|
| Open | Tellado Ruben | $158,720 | |
| Previous Owner | Smith Rodney D | $194,880 | |
| Previous Owner | Smith Rodney D | $159,900 |
Source: Public Records
Tax History Compared to Growth
Tax History
| Year | Tax Paid | Tax Assessment Tax Assessment Total Assessment is a certain percentage of the fair market value that is determined by local assessors to be the total taxable value of land and additions on the property. | Land | Improvement |
|---|---|---|---|---|
| 2024 | $5,042 | $20,183 | $3,479 | $16,704 |
| 2023 | $4,287 | $20,183 | $3,479 | $16,704 |
| 2022 | $4,287 | $15,399 | $3,025 | $12,374 |
| 2021 | $4,084 | $15,398 | $3,025 | $12,373 |
| 2020 | $4,091 | $15,398 | $3,025 | $12,373 |
| 2019 | $3,446 | $13,583 | $2,722 | $10,861 |
| 2018 | $3,300 | $13,583 | $2,722 | $10,861 |
| 2017 | $3,426 | $13,583 | $2,722 | $10,861 |
| 2016 | $3,107 | $11,364 | $2,268 | $9,096 |
| 2015 | $3,094 | $11,594 | $2,268 | $9,326 |
| 2014 | $4,237 | $15,125 | $2,268 | $12,857 |
| 2013 | $3,057 | $12,526 | $2,268 | $10,258 |
Source: Public Records
Map
Nearby Homes
- 5400 135th St Unit 5406
- 5400 135th St Unit 5404
- 13533 Short Dr
- 13537 Latrobe Ave Unit 7
- 13231 E Playfield Dr
- 5437 138th Place
- 5409 138th Place
- 13426 W Circle Dr Unit 302
- 13515 Le Claire Ave Unit 56
- 13422 W Circle Dr Unit 401
- 13520 Lawler Ave Unit 42
- 13540 Lawler Ave Unit 83
- 4959 134th Place Unit 2C
- 13300 W Circle Drive Pkwy Unit G222
- 4955 134th Place Unit 2A
- 4955 134th Place Unit 3B
- 5723 129th St Unit 7E
- 4930 134th Ct Unit 312
- 4920 134th Ct Unit 206
- 4920 134th Ct Unit 205
- 13401 S End Ln
- 13347 S End Ln
- 13400 Crestwood Ct
- 13407 S End Ln
- 5525 Homestead Dr
- 5519 Homestead Dr
- 13410 Crestwood Ct
- 13413 S End Ln
- 13352 S End Ln
- 13400 S End Ln
- 5513 Homestead Dr
- 13406 S End Ln
- 13346 S End Ln
- 13401 Crestwood Ct
- 13412 S End Ln
- 5514 Crestwood Dr
- 13340 S End Ln
- 5507 Homestead Dr
- 13419 S End Ln
- 5508 Crestwood Dr