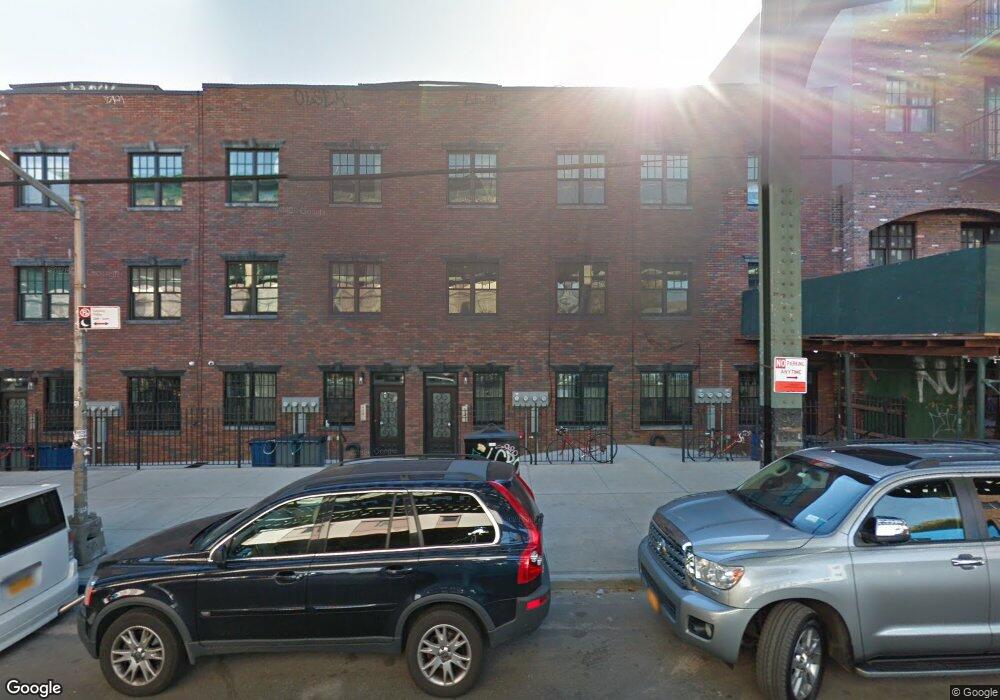
1336-1338 Myrtle Ave Brooklyn, NY 11221
Bushwick NeighborhoodEstimated Value: $1,239,000 - $1,891,000
--
Bed
--
Bath
2,400
Sq Ft
$616/Sq Ft
Est. Value
About This Home
This home is located at 1336-1338 Myrtle Ave, Brooklyn, NY 11221 and is currently estimated at $1,479,388, approximately $616 per square foot. 1336-1338 Myrtle Ave is a home located in Kings County with nearby schools including P.S. 274 The Kosciusko School, Success Academy Charter School-Nyc 10, and St. Brigid-St. Frances Cabrini Catholic Academy.
Ownership History
Date
Name
Owned For
Owner Type
Purchase Details
Closed on
Sep 19, 2022
Sold by
1334 1338 Myrtle Group Llc
Bought by
Myrtle 1336 Enterprise Llc
Current Estimated Value
Purchase Details
Closed on
Dec 21, 2012
Sold by
Community Group Inc
Bought by
1328-1346 Myrtle Group Llc and 1350 Myrtle Llc
Home Financials for this Owner
Home Financials are based on the most recent Mortgage that was taken out on this home.
Original Mortgage
$999,900
Interest Rate
3.36%
Mortgage Type
Purchase Money Mortgage
Purchase Details
Closed on
Aug 12, 2003
Sold by
Real Plan Inc
Bought by
Community Group Inc
Purchase Details
Closed on
Jan 4, 1996
Sold by
Rodriguez Manuel
Bought by
Real Plan Inc
Create a Home Valuation Report for This Property
The Home Valuation Report is an in-depth analysis detailing your home's value as well as a comparison with similar homes in the area
Home Values in the Area
Average Home Value in this Area
Purchase History
| Date | Buyer | Sale Price | Title Company |
|---|---|---|---|
| Myrtle 1336 Enterprise Llc | $1,290,000 | -- | |
| 1328-1346 Myrtle Group Llc | $1,700,000 | -- | |
| 1328-1346 Myrtle Group Llc | $1,700,000 | -- | |
| Community Group Inc | -- | -- | |
| Community Group Inc | -- | -- | |
| Real Plan Inc | -- | First American Title Ins Co | |
| Real Plan Inc | -- | First American Title Ins Co |
Source: Public Records
Mortgage History
| Date | Status | Borrower | Loan Amount |
|---|---|---|---|
| Previous Owner | 1328-1346 Myrtle Group Llc | $999,900 |
Source: Public Records
Tax History Compared to Growth
Tax History
| Year | Tax Paid | Tax Assessment Tax Assessment Total Assessment is a certain percentage of the fair market value that is determined by local assessors to be the total taxable value of land and additions on the property. | Land | Improvement |
|---|---|---|---|---|
| 2025 | $17,663 | $91,560 | $16,500 | $75,060 |
| 2024 | $17,663 | $91,140 | $16,500 | $74,640 |
| 2023 | $16,849 | $111,840 | $16,500 | $95,340 |
| 2022 | $15,624 | $113,700 | $16,500 | $97,200 |
| 2021 | $15,539 | $105,180 | $16,500 | $88,680 |
| 2020 | $7,724 | $82,680 | $16,500 | $66,180 |
| 2019 | $15,446 | $82,680 | $16,500 | $66,180 |
| 2018 | $14,837 | $72,785 | $13,238 | $59,547 |
| 2017 | $13,998 | $68,666 | $15,191 | $53,475 |
| 2016 | $7,383 | $36,931 | $13,523 | $23,408 |
| 2015 | $2,984 | $12,120 | $12,120 | $0 |
| 2014 | $2,984 | $47,700 | $36,450 | $11,250 |
Source: Public Records
Map
Nearby Homes
- 229 Central Ave
- 1365 Dekalb Ave
- 172 Wilson Ave
- 172 Wilson Ave Unit 4L
- 111 Harman St
- 89 Stanhope St
- 92 Stockholm St
- 768 Hart St Unit 1
- 768 Hart St Unit 2L
- 91 Harman St
- 229 Stanhope St
- 84 Himrod St
- 318 Knickerbocker Ave Unit 3D
- 318 Knickerbocker Ave Unit 2A
- 1484 Dekalb Ave Unit A
- 78 Harman St Unit 3-R
- 78 Harman St Unit 1-R
- 78 Harman St Unit 2-R
- 78 Harman St Unit 4-R
- 78 Harman St Unit 3-F
- 1338 Myrtle Ave
- 1334 Myrtle Ave
- 1334 Myrtle Ave Unit 2
- 1334 Myrtle Ave Unit 1
- 1340-1342 Myrtle Ave
- 140 Stanhope St Unit 2A
- 140 Stanhope St
- 1342 Myrtle Ave
- 1344 Myrtle Ave Unit 1
- 1344 Myrtle Ave
- 173-175 Himrod St
- 132-134 Stanhope St
- 171 Himrod St
- 1346 Myrtle Ave
- 1348 Myrtle Ave
- 1363 Myrtle Ave Unit 4L
- 1363-1365 Myrtle Ave
- 1350 Myrtle Ave Unit 1354
- 1350 Myrtle Ave Unit 1C
- 132A Stanhope St