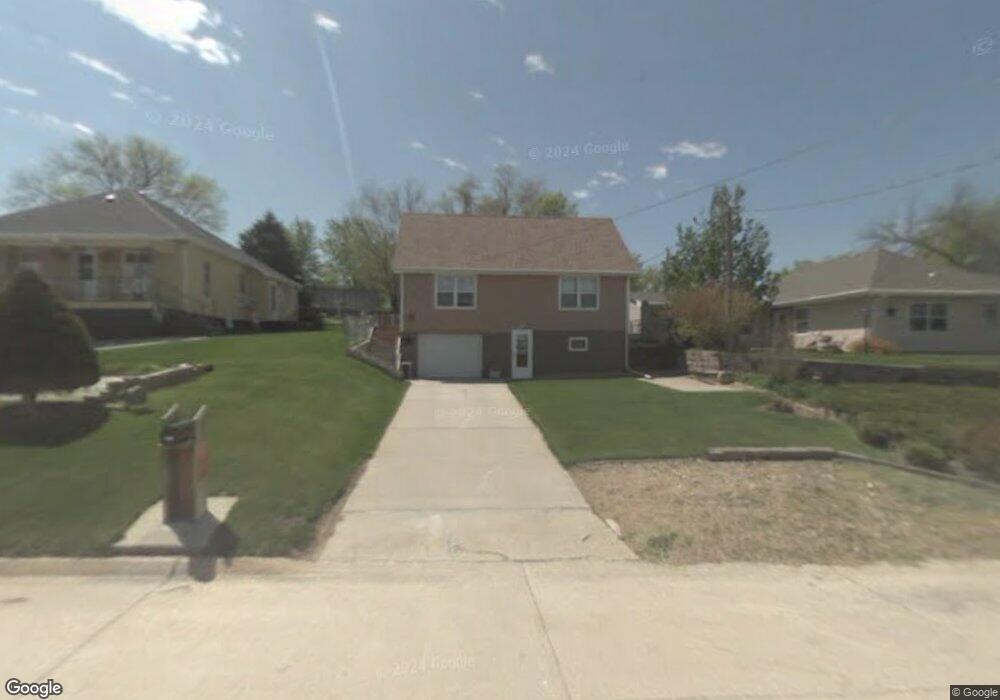
1336 S H St Broken Bow, NE 68822
Estimated Value: $101,000 - $135,761
--
Bed
2
Baths
1,168
Sq Ft
$103/Sq Ft
Est. Value
About This Home
This home is located at 1336 S H St, Broken Bow, NE 68822 and is currently estimated at $120,190, approximately $102 per square foot. 1336 S H St is a home located in Custer County with nearby schools including North Park Elementary School, Broken Bow Junior High School, and Broken Bow High School.
Ownership History
Date
Name
Owned For
Owner Type
Purchase Details
Closed on
Sep 21, 2012
Sold by
Jobman Patricia Ann Liv Trust
Bought by
Camacho William I and Camacho Caylynn
Current Estimated Value
Purchase Details
Closed on
Jul 12, 2010
Sold by
Mccaslin James E and Mccaslin Tammy
Bought by
Mcfall Tammy
Purchase Details
Closed on
Jun 21, 2010
Sold by
Mcfall Tammy
Bought by
Jobman Patricia Ann Liv Trust
Purchase Details
Closed on
Jun 29, 2006
Sold by
Schiltz Eugene R and Schiltz Judy
Bought by
Mccaslin James E and Mccaslin Tammy
Create a Home Valuation Report for This Property
The Home Valuation Report is an in-depth analysis detailing your home's value as well as a comparison with similar homes in the area
Home Values in the Area
Average Home Value in this Area
Purchase History
| Date | Buyer | Sale Price | Title Company |
|---|---|---|---|
| Camacho William I | $73,000 | -- | |
| Mcfall Tammy | -- | -- | |
| Jobman Patricia Ann Liv Trust | $76,500 | -- | |
| Mccaslin James E | $59,500 | -- |
Source: Public Records
Tax History Compared to Growth
Tax History
| Year | Tax Paid | Tax Assessment Tax Assessment Total Assessment is a certain percentage of the fair market value that is determined by local assessors to be the total taxable value of land and additions on the property. | Land | Improvement |
|---|---|---|---|---|
| 2025 | $1,252 | $107,672 | $8,000 | $99,672 |
| 2024 | $1,252 | $91,377 | $8,000 | $83,377 |
| 2023 | $1,293 | $82,544 | $8,000 | $74,544 |
| 2022 | $1,419 | $77,302 | $8,000 | $69,302 |
| 2021 | $1,378 | $76,802 | $7,500 | $69,302 |
| 2020 | $1,366 | $76,802 | $7,500 | $69,302 |
| 2019 | $1,442 | $81,234 | $3,750 | $77,484 |
| 2017 | $1,367 | $74,860 | $3,750 | $71,110 |
| 2016 | $1,470 | $73,560 | $2,450 | $71,110 |
| 2015 | $1,659 | $82,320 | $2,420 | $79,900 |
| 2014 | $1,659 | $74,836 | $2,200 | $72,636 |
Source: Public Records
Map
Nearby Homes