


1337 24th St None Des Moines, IA 50311
Drake NeighborhoodEstimated payment $1,328/month
Highlights
- 3 Kitchens
- No HOA
- Forced Air Heating System
About This Home
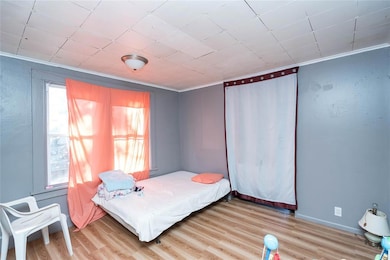
Fully Occupied Tri-Plex Opportunity. No owner utilities. Fully occupied on MTM leases with upside in raising rents. Located just 2 blocks from Drake University
Property Details
Home Type
- Multi-Family
Est. Annual Taxes
- $2,184
Parking
- Gravel Driveway
Home Design
- Block Foundation
- Asphalt Shingled Roof
Utilities
- Window Unit Cooling System
- Forced Air Heating System
Additional Features
- 3 Kitchens
Community Details
- No Home Owners Association
Listing and Financial Details
- Assessor Parcel Number 080/01568-000-000
Map
Home Values in the Area
Average Home Value in this Area
Tax History
| Year | Tax Paid | Tax Assessment Tax Assessment Total Assessment is a certain percentage of the fair market value that is determined by local assessors to be the total taxable value of land and additions on the property. | Land | Improvement |
|---|---|---|---|---|
| 2025 | $2,184 | $120,000 | $27,300 | $92,700 |
| 2024 | $2,184 | $111,000 | $24,000 | $87,000 |
| 2023 | $2,128 | $111,000 | $24,000 | $87,000 |
| 2022 | $2,488 | $90,300 | $20,100 | $70,200 |
| 2021 | $2,210 | $90,300 | $20,100 | $70,200 |
| 2020 | $2,482 | $74,000 | $18,200 | $55,800 |
| 2019 | $2,178 | $74,000 | $18,200 | $55,800 |
| 2018 | $2,316 | $61,500 | $18,200 | $43,300 |
| 2017 | $2,292 | $61,500 | $18,200 | $43,300 |
| 2016 | $3,760 | $58,500 | $15,000 | $43,500 |
| 2015 | $3,760 | $92,000 | $15,200 | $76,800 |
| 2014 | $3,518 | $82,000 | $15,200 | $66,800 |
Property History
| Date | Event | Price | List to Sale | Price per Sq Ft |
|---|---|---|---|---|
| 08/27/2025 08/27/25 | For Sale | $216,000 | -- | -- |
Purchase History
| Date | Type | Sale Price | Title Company |
|---|---|---|---|
| Warranty Deed | $49,500 | -- | |
| Warranty Deed | $57,500 | -- | |
| Land Contract | $50,000 | -- |
Source: Des Moines Area Association of REALTORS®
MLS Number: 725059
APN: 080-01568000000
Disclaimer: Certain information contained herein is derived from information provided by parties other than Homes.com. All information provided is deemed reliable, but is not guaranteed to be accurate and should be independently verified.
![]() IDX information is provided exclusively for personal, non-commercial use, and may not be used for any purpose other than to identify prospective properties consumers may be interested in purchasing. Information is deemed reliable but not guaranteed.
IDX information is provided exclusively for personal, non-commercial use, and may not be used for any purpose other than to identify prospective properties consumers may be interested in purchasing. Information is deemed reliable but not guaranteed.
- 1359 24th St None
- 1332 23rd Street None
- 1340 23rd Street None
- 1303 22nd St
- 1411 22nd Street None
- 2210 University Ave
- 1436 21st St
- 1434 Martin Luther King Junior Pkwy
- 1559 23rd St
- 1120 23rd St Unit 6
- 1175 21st St
- 1429 Martin Luther King jr Pkwy
- 1132 26th St
- 1107 24th St
- 2305 Drake Park Ave
- 1605 22nd St
- 1557 27th St
- 1070 22nd St
- 2812 Brattleboro Ave
- 1113 21st Street None
- 1314 22nd St
- 1312 22nd St
- 1217 24th St
- 1215 23rd St Unit 1215 23RD apt #3
- 1333 22nd St
- 2225 University Ave
- 2328 University Ave
- 2300 University Ave
- 2530 University Ave
- 2530 University Ave Unit ID1036809P
- 2530 University Ave Unit ID1036858P
- 2530 University Ave Unit ID1036853P
- 2530 University Ave Unit ID1036854P
- 1123 24th St Unit 1
- 1123 24th St Unit 1
- 1123 24th St Unit 1
- 2705 Meek Ave
- 2813 Cottage Grove Ave
- 1051 19th St
- 3103-3109 Forest Ave
