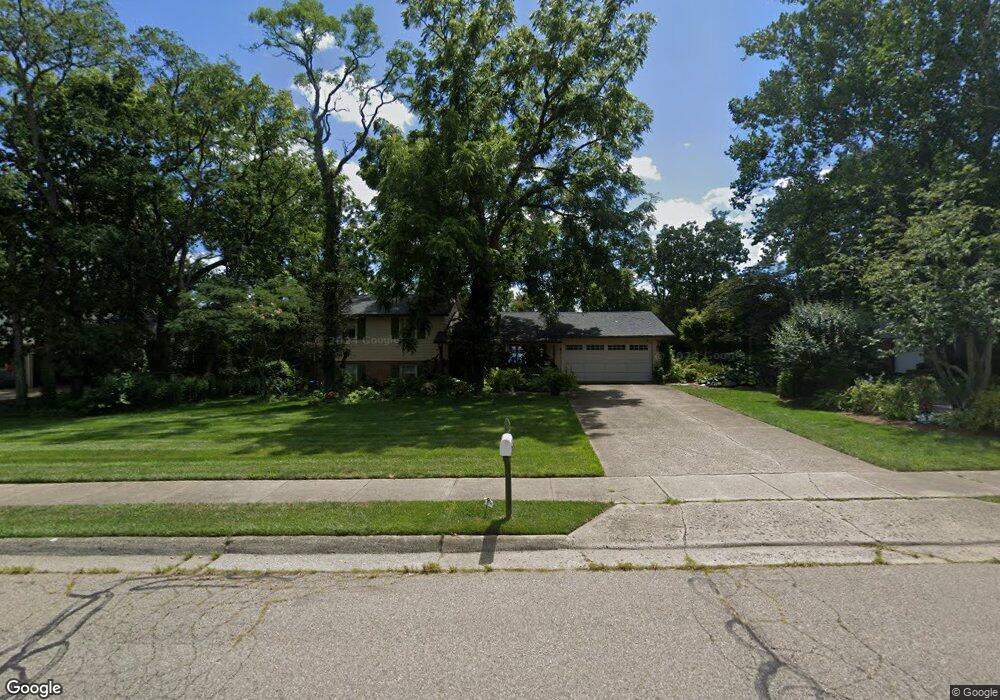
1337 Dana Dr Oxford, OH 45056
Estimated Value: $296,000 - $346,000
3
Beds
2
Baths
1,232
Sq Ft
$254/Sq Ft
Est. Value
About This Home
This home is located at 1337 Dana Dr, Oxford, OH 45056 and is currently estimated at $313,083, approximately $254 per square foot. 1337 Dana Dr is a home located in Butler County with nearby schools including Talawanda Middle School, Talawanda High School, and Mcguffey Montessori School.
Ownership History
Date
Name
Owned For
Owner Type
Purchase Details
Closed on
Aug 29, 2005
Sold by
Vanatsky James M and Vanatsky Margaret A
Bought by
Princell Kristin K
Current Estimated Value
Home Financials for this Owner
Home Financials are based on the most recent Mortgage that was taken out on this home.
Original Mortgage
$149,600
Outstanding Balance
$80,238
Interest Rate
5.89%
Mortgage Type
Fannie Mae Freddie Mac
Estimated Equity
$232,845
Purchase Details
Closed on
Jun 20, 2002
Sold by
Oglesbee Mark D and Oglesbee Jill R
Bought by
Vanatsky James M and Vanatsky Margaret A
Purchase Details
Closed on
Aug 29, 1994
Sold by
Slager James
Bought by
Oglesbee Mark D and Oglesbee Jill
Home Financials for this Owner
Home Financials are based on the most recent Mortgage that was taken out on this home.
Original Mortgage
$104,800
Interest Rate
6.5%
Mortgage Type
New Conventional
Purchase Details
Closed on
May 1, 1988
Create a Home Valuation Report for This Property
The Home Valuation Report is an in-depth analysis detailing your home's value as well as a comparison with similar homes in the area
Home Values in the Area
Average Home Value in this Area
Purchase History
| Date | Buyer | Sale Price | Title Company |
|---|---|---|---|
| Princell Kristin K | $187,000 | Vintage Title Agency Inc | |
| Vanatsky James M | $155,000 | -- | |
| Oglesbee Mark D | $116,500 | -- | |
| -- | $95,000 | -- |
Source: Public Records
Mortgage History
| Date | Status | Borrower | Loan Amount |
|---|---|---|---|
| Open | Princell Kristin K | $149,600 | |
| Previous Owner | Oglesbee Mark D | $104,800 |
Source: Public Records
Tax History Compared to Growth
Tax History
| Year | Tax Paid | Tax Assessment Tax Assessment Total Assessment is a certain percentage of the fair market value that is determined by local assessors to be the total taxable value of land and additions on the property. | Land | Improvement |
|---|---|---|---|---|
| 2024 | $3,027 | $82,130 | $18,320 | $63,810 |
| 2023 | $2,905 | $83,160 | $18,320 | $64,840 |
| 2022 | $2,434 | $62,680 | $18,320 | $44,360 |
| 2021 | $2,318 | $62,680 | $18,320 | $44,360 |
| 2020 | $2,423 | $62,680 | $18,320 | $44,360 |
| 2019 | $4,348 | $57,560 | $17,960 | $39,600 |
| 2018 | $2,347 | $57,560 | $17,960 | $39,600 |
| 2017 | $2,109 | $57,560 | $17,960 | $39,600 |
| 2016 | $2,044 | $53,980 | $17,960 | $36,020 |
| 2015 | $2,080 | $53,980 | $17,960 | $36,020 |
| 2014 | $2,189 | $53,980 | $17,960 | $36,020 |
| 2013 | $2,189 | $55,780 | $17,960 | $37,820 |
Source: Public Records
Map
Nearby Homes
- 0 Dana Dr Unit 1860017
- 40 Charleston Dr Unit 4
- 715 W Chestnut St
- 4215 Kehr Rd
- 29 Gardenia Dr
- 446 Emerald Woods Dr
- 620 Brill Dr
- 616 Brill Dr
- 509 White Oak Dr
- 6038 Booth Rd
- 812 Winding Brook Dr
- 6 Autumn Dr
- 7 Robin Ct
- 1020 Tollgate Dr
- 1024 Arrowhead Dr
- 6135 Fairfield Rd
- 3806 Kehr Rd
- 114 Ardmore Dr
- 60 Autumn Dr
- 108 Linwood Ln