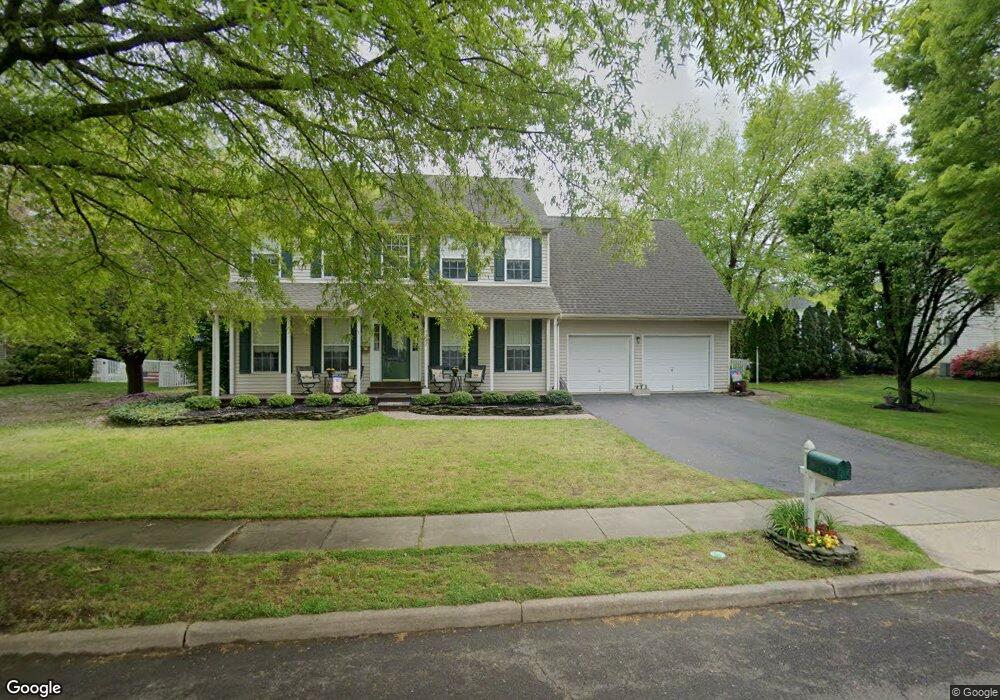
1337 Maple Ave Roebling, NJ 08554
Estimated Value: $475,745 - $611,000
Studio
--
Bath
2,377
Sq Ft
$227/Sq Ft
Est. Value
About This Home
This home is located at 1337 Maple Ave, Roebling, NJ 08554 and is currently estimated at $538,936, approximately $226 per square foot. 1337 Maple Ave is a home located in Burlington County with nearby schools including Number 5, Roebling Elementary School, Riverfront Middle School, and Florence Twp Mem High School.
Ownership History
Date
Name
Owned For
Owner Type
Purchase Details
Closed on
Apr 17, 1998
Sold by
Kelly & Mcgowan Builders Llc
Bought by
Muchowski Michael J and Muchowski Kim M
Current Estimated Value
Home Financials for this Owner
Home Financials are based on the most recent Mortgage that was taken out on this home.
Original Mortgage
$139,000
Outstanding Balance
$26,248
Interest Rate
7.04%
Estimated Equity
$512,688
Create a Home Valuation Report for This Property
The Home Valuation Report is an in-depth analysis detailing your home's value as well as a comparison with similar homes in the area
Home Values in the Area
Average Home Value in this Area
Purchase History
| Date | Buyer | Sale Price | Title Company |
|---|---|---|---|
| Muchowski Michael J | $173,800 | -- |
Source: Public Records
Mortgage History
| Date | Status | Borrower | Loan Amount |
|---|---|---|---|
| Open | Muchowski Michael J | $139,000 |
Source: Public Records
Tax History
| Year | Tax Paid | Tax Assessment Tax Assessment Total Assessment is a certain percentage of the fair market value that is determined by local assessors to be the total taxable value of land and additions on the property. | Land | Improvement |
|---|---|---|---|---|
| 2025 | $9,518 | $341,500 | $104,000 | $237,500 |
| 2024 | $9,111 | $341,500 | $104,000 | $237,500 |
| 2023 | $9,111 | $341,500 | $104,000 | $237,500 |
| 2022 | $8,917 | $341,500 | $104,000 | $237,500 |
| 2021 | $8,838 | $341,500 | $104,000 | $237,500 |
| 2020 | $8,804 | $341,500 | $104,000 | $237,500 |
| 2019 | $8,725 | $341,500 | $104,000 | $237,500 |
| 2018 | $8,650 | $341,500 | $104,000 | $237,500 |
| 2017 | $8,544 | $341,500 | $104,000 | $237,500 |
| 2016 | $8,380 | $341,500 | $104,000 | $237,500 |
| 2015 | $8,414 | $350,000 | $104,000 | $246,000 |
| 2014 | $8,640 | $369,700 | $104,000 | $265,700 |
Source: Public Records
Map
Nearby Homes
Your Personal Tour Guide
Ask me questions while you tour the home.