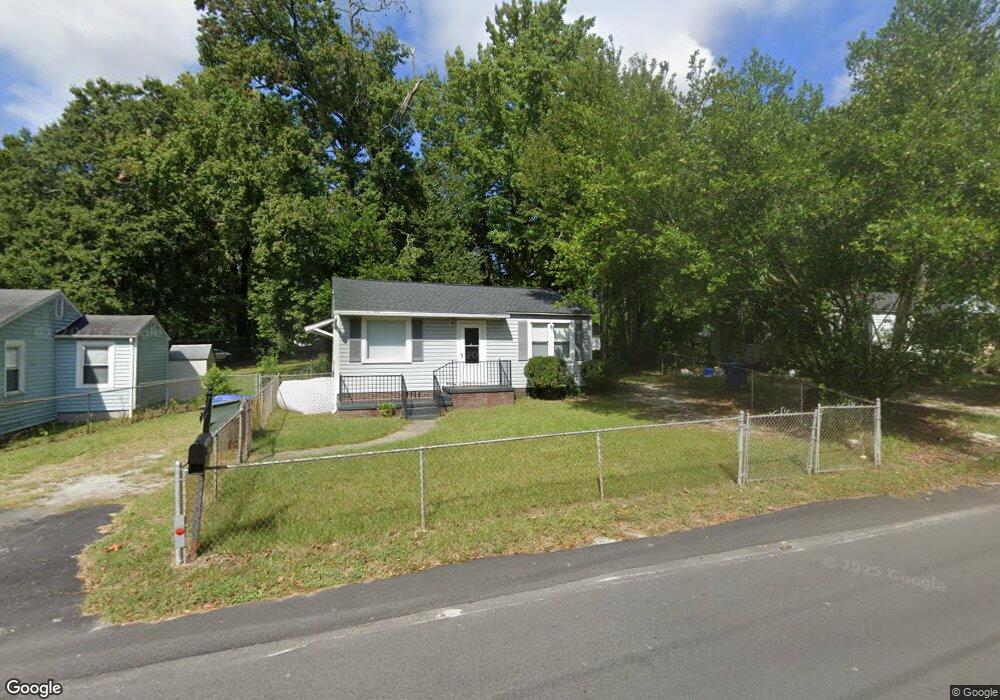
1337 S Ott Rd Columbia, SC 29205
Rosewood NeighborhoodEstimated Value: $102,000 - $160,000
2
Beds
1
Bath
780
Sq Ft
$171/Sq Ft
Est. Value
About This Home
This home is located at 1337 S Ott Rd, Columbia, SC 29205 and is currently estimated at $133,153, approximately $170 per square foot. 1337 S Ott Rd is a home located in Richland County with nearby schools including South Kilbourne Elementary School, Hand Middle School, and Dreher High School.
Ownership History
Date
Name
Owned For
Owner Type
Purchase Details
Closed on
Jun 29, 2000
Sold by
Smith J Kyle
Bought by
Rust Ronald E
Current Estimated Value
Home Financials for this Owner
Home Financials are based on the most recent Mortgage that was taken out on this home.
Original Mortgage
$33,000
Interest Rate
8.63%
Purchase Details
Closed on
Apr 6, 2000
Sold by
Hud
Bought by
Smith J Kyle and Dysky Unlimited Properties
Purchase Details
Closed on
Aug 30, 1999
Sold by
Vanderbilt Singleton
Bought by
Hud
Create a Home Valuation Report for This Property
The Home Valuation Report is an in-depth analysis detailing your home's value as well as a comparison with similar homes in the area
Home Values in the Area
Average Home Value in this Area
Purchase History
| Date | Buyer | Sale Price | Title Company |
|---|---|---|---|
| Rust Ronald E | $40,000 | -- | |
| Smith J Kyle | $23,500 | -- | |
| Dysky Unlimited Properties | $23,500 | -- | |
| Hud | $2,500 | -- |
Source: Public Records
Mortgage History
| Date | Status | Borrower | Loan Amount |
|---|---|---|---|
| Closed | Rust Ronald E | $33,000 |
Source: Public Records
Tax History Compared to Growth
Tax History
| Year | Tax Paid | Tax Assessment Tax Assessment Total Assessment is a certain percentage of the fair market value that is determined by local assessors to be the total taxable value of land and additions on the property. | Land | Improvement |
|---|---|---|---|---|
| 2024 | $1,560 | $57,000 | $0 | $0 |
| 2023 | $1,560 | $1,984 | $0 | $0 |
| 2022 | $1,436 | $49,600 | $10,000 | $39,600 |
| 2021 | $1,448 | $2,980 | $0 | $0 |
| 2020 | $1,469 | $2,980 | $0 | $0 |
| 2019 | $1,473 | $2,980 | $0 | $0 |
| 2018 | $1,480 | $2,960 | $0 | $0 |
| 2017 | $1,440 | $2,960 | $0 | $0 |
| 2016 | $1,400 | $2,960 | $0 | $0 |
| 2015 | $1,392 | $2,960 | $0 | $0 |
| 2014 | $1,379 | $49,300 | $0 | $0 |
| 2013 | -- | $2,960 | $0 | $0 |
Source: Public Records
Map
Nearby Homes