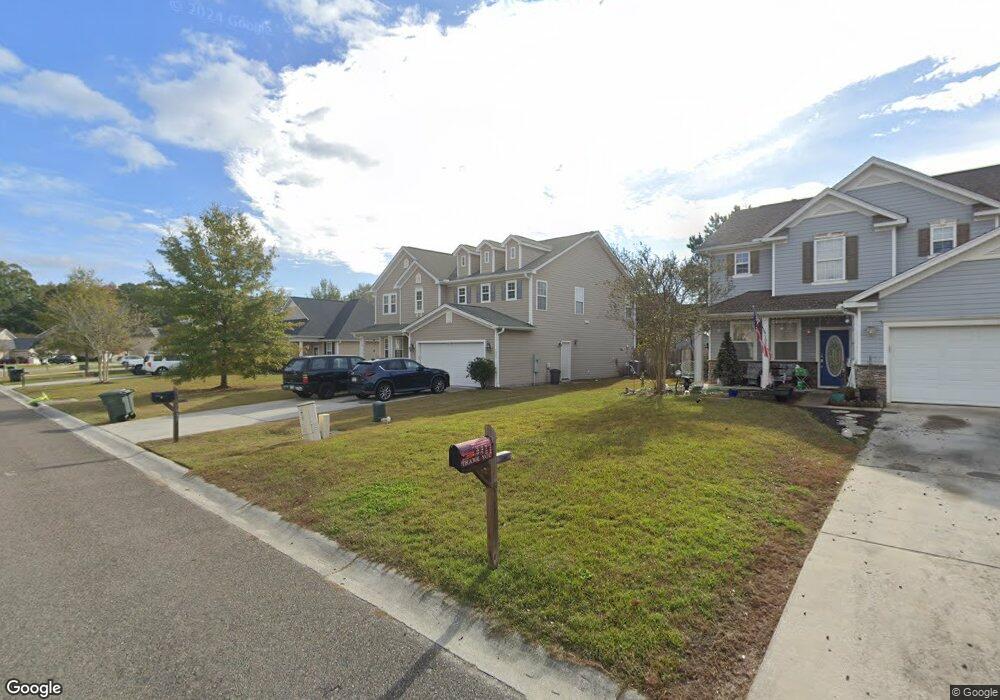
1337 Song Sparrow Way Hanahan, SC 29410
Estimated Value: $496,000 - $531,000
--
Bed
--
Bath
2,688
Sq Ft
$191/Sq Ft
Est. Value
About This Home
This home is located at 1337 Song Sparrow Way, Hanahan, SC 29410 and is currently estimated at $514,572, approximately $191 per square foot. 1337 Song Sparrow Way is a home located in Berkeley County with nearby schools including Bowen's Corner Elementary, Hanahan Middle School, and Hanahan High School.
Ownership History
Date
Name
Owned For
Owner Type
Purchase Details
Closed on
Aug 30, 2024
Sold by
Delamielleure Todd J and Delamielleure Melinda M
Bought by
Spade Thomas M and Spade Esther R
Current Estimated Value
Home Financials for this Owner
Home Financials are based on the most recent Mortgage that was taken out on this home.
Original Mortgage
$474,251
Outstanding Balance
$469,226
Interest Rate
6.78%
Mortgage Type
FHA
Estimated Equity
$45,346
Purchase Details
Closed on
Dec 28, 2006
Sold by
Kb Home South Carolina Inc
Bought by
Delamielleure Todd J and Delamielleure Melinda M
Home Financials for this Owner
Home Financials are based on the most recent Mortgage that was taken out on this home.
Original Mortgage
$57,589
Interest Rate
6.06%
Mortgage Type
Credit Line Revolving
Purchase Details
Closed on
Aug 2, 2006
Sold by
Charleston Brown Co Llc
Bought by
Kb Home South Carolina Llc
Create a Home Valuation Report for This Property
The Home Valuation Report is an in-depth analysis detailing your home's value as well as a comparison with similar homes in the area
Home Values in the Area
Average Home Value in this Area
Purchase History
| Date | Buyer | Sale Price | Title Company |
|---|---|---|---|
| Spade Thomas M | $483,000 | None Listed On Document | |
| Delamielleure Todd J | $287,944 | None Available | |
| Kb Home South Carolina Llc | $299,280 | None Available |
Source: Public Records
Mortgage History
| Date | Status | Borrower | Loan Amount |
|---|---|---|---|
| Open | Spade Thomas M | $474,251 | |
| Previous Owner | Delamielleure Todd J | $57,589 | |
| Previous Owner | Delamielleure Todd J | $230,355 |
Source: Public Records
Tax History Compared to Growth
Tax History
| Year | Tax Paid | Tax Assessment Tax Assessment Total Assessment is a certain percentage of the fair market value that is determined by local assessors to be the total taxable value of land and additions on the property. | Land | Improvement |
|---|---|---|---|---|
| 2025 | $5,368 | $480,700 | $100,000 | $380,700 |
| 2024 | $5,368 | $19,228 | $4,000 | $15,228 |
| 2023 | $5,368 | $18,219 | $3,401 | $14,818 |
| 2022 | $5,099 | $15,842 | $2,516 | $13,326 |
| 2021 | $4,947 | $15,850 | $2,516 | $13,326 |
| 2020 | $4,809 | $15,842 | $2,516 | $13,326 |
| 2019 | $4,864 | $15,842 | $2,516 | $13,326 |
| 2018 | $4,497 | $13,776 | $2,880 | $10,896 |
| 2017 | $4,467 | $13,776 | $2,880 | $10,896 |
| 2016 | $4,501 | $13,780 | $2,880 | $10,900 |
| 2015 | $4,230 | $13,780 | $2,880 | $10,900 |
| 2014 | $1,201 | $9,180 | $1,920 | $7,260 |
| 2013 | -- | $9,180 | $1,920 | $7,260 |
Source: Public Records
Map
Nearby Homes
- 1333 Song Sparrow Way
- 7326 Kestrel Trail
- 7303 Kestrel Trail
- 7402 Purser Ln
- 7304 Kestrel Trail
- 7406 Mercedes Way
- 7434 Northgate Dr
- 7317 Horned Grebe Ct
- 7316 Water Thrush Ct
- 7358 Suncatcher Dr
- 1038 Old Cypress Run
- 7316 Stoney Moss Way
- 7532 Hawks Cir
- 202 Waterwood Dr Unit 2302
- 605 Waterwood Dr Unit 1505
- 607 Waterwood Dr
- 201 Greenmeadow Dr
- 202 Greenmeadow Dr
- 1005 Waterwood Dr
- 1001 Waterwood Dr Unit 1301
- 1339 Song Sparrow Way
- 1335 Song Sparrow Way
- 7344 Kestrel Trail
- 7330 Coopers Hawk Dr
- 1341 Song Sparrow Way
- 7342 Kestrel Trail
- 1336 Song Sparrow Way
- 1334 Song Sparrow Way
- 1331 Song Sparrow Way
- 1340 Song Sparrow Way
- 1332 Song Sparrow Way
- 7340 Kestrel Trail
- 7328 Coopers Hawk Dr
- 1330 Song Sparrow Way
- 1329 Song Sparrow Way
- 7326 Coopers Hawk Dr
- 7338 Kestrel Trail
- 7329 Coopers Hawk Dr
- 1328 Song Sparrow Way
- 1327 Song Sparrow Way