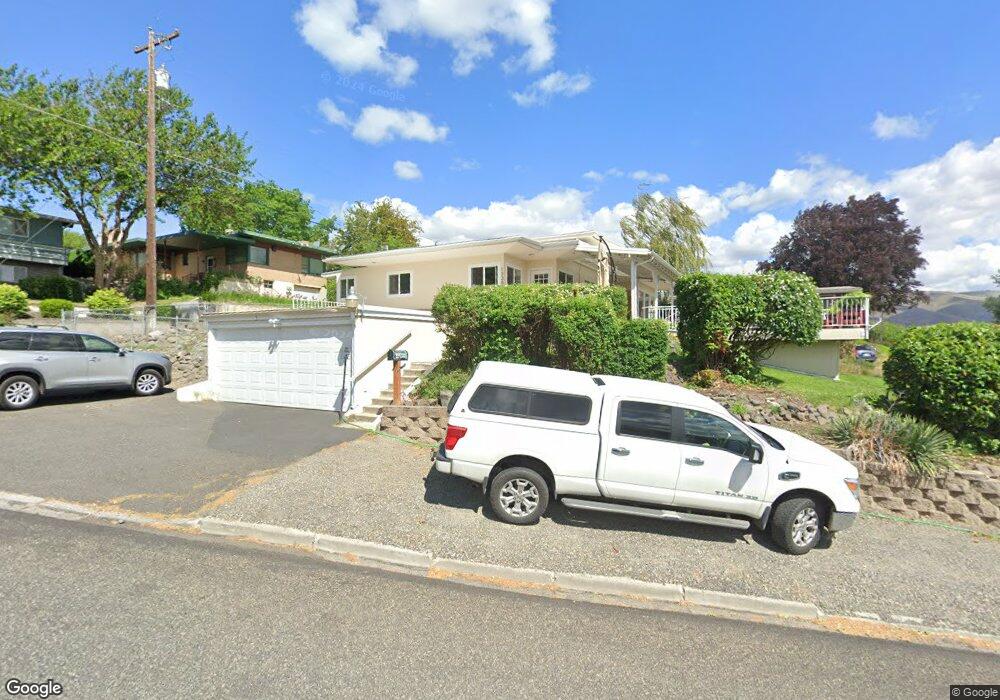
1338 3rd St Clarkston, WA 99403
Estimated Value: $307,000 - $567,000
--
Bed
--
Bath
2,292
Sq Ft
$201/Sq Ft
Est. Value
About This Home
This home is located at 1338 3rd St, Clarkston, WA 99403 and is currently estimated at $461,196, approximately $201 per square foot. 1338 3rd St is a home located in Asotin County with nearby schools including Parkway Elementary School, Lincoln Middle School, and Charles Francis Adams High School.
Ownership History
Date
Name
Owned For
Owner Type
Purchase Details
Closed on
Sep 21, 2022
Sold by
Wahlberg Julie A and Wahlberg Brent W
Bought by
Wahlberg Brent W
Current Estimated Value
Home Financials for this Owner
Home Financials are based on the most recent Mortgage that was taken out on this home.
Original Mortgage
$222,600
Outstanding Balance
$209,073
Interest Rate
5.55%
Mortgage Type
Credit Line Revolving
Estimated Equity
$252,123
Purchase Details
Closed on
Jul 21, 2017
Sold by
Wahlberg Brent Wesley
Bought by
Wahlberg Brent W
Home Financials for this Owner
Home Financials are based on the most recent Mortgage that was taken out on this home.
Original Mortgage
$196,000
Interest Rate
3.91%
Mortgage Type
New Conventional
Create a Home Valuation Report for This Property
The Home Valuation Report is an in-depth analysis detailing your home's value as well as a comparison with similar homes in the area
Home Values in the Area
Average Home Value in this Area
Purchase History
| Date | Buyer | Sale Price | Title Company |
|---|---|---|---|
| Wahlberg Brent W | -- | Alliance Title | |
| Wahlberg Brent W | -- | Alliance Title & Escrow |
Source: Public Records
Mortgage History
| Date | Status | Borrower | Loan Amount |
|---|---|---|---|
| Open | Wahlberg Brent W | $222,600 | |
| Previous Owner | Wahlberg Brent W | $196,000 |
Source: Public Records
Tax History Compared to Growth
Tax History
| Year | Tax Paid | Tax Assessment Tax Assessment Total Assessment is a certain percentage of the fair market value that is determined by local assessors to be the total taxable value of land and additions on the property. | Land | Improvement |
|---|---|---|---|---|
| 2025 | $4,075 | $350,400 | $52,500 | $297,900 |
| 2023 | $4,075 | $223,700 | $52,500 | $171,200 |
| 2022 | $2,569 | $223,700 | $52,500 | $171,200 |
| 2021 | $2,820 | $223,700 | $52,500 | $171,200 |
| 2020 | $2,519 | $223,700 | $52,500 | $171,200 |
| 2019 | $2,149 | $197,400 | $40,000 | $157,400 |
| 2018 | $2,598 | $197,400 | $40,000 | $157,400 |
| 2017 | $2,435 | $197,400 | $40,000 | $157,400 |
| 2016 | $2,435 | $197,400 | $40,000 | $157,400 |
| 2015 | $242 | $191,300 | $40,000 | $151,300 |
| 2013 | $2,431 | $186,900 | $40,000 | $146,900 |
Source: Public Records
Map
Nearby Homes