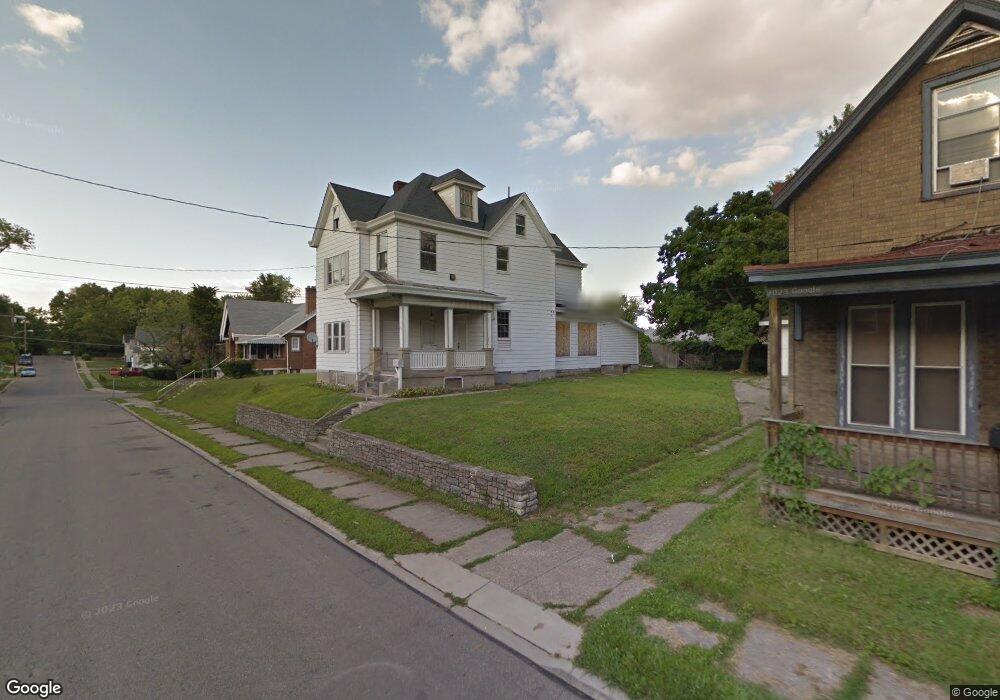
1338 Beech Ave Cincinnati, OH 45205
West Price Hill NeighborhoodEstimated Value: $147,000 - $191,105
4
Beds
1
Bath
2,008
Sq Ft
$86/Sq Ft
Est. Value
About This Home
This home is located at 1338 Beech Ave, Cincinnati, OH 45205 and is currently estimated at $172,526, approximately $85 per square foot. 1338 Beech Ave is a home located in Hamilton County with nearby schools including Carson School, Gilbert A. Dater High School, and Western Hills High School.
Ownership History
Date
Name
Owned For
Owner Type
Purchase Details
Closed on
Aug 12, 2008
Sold by
Secretary Of Housing & Urban Development
Bought by
Sopapia Pratchaya
Current Estimated Value
Purchase Details
Closed on
Jun 18, 2007
Sold by
Tribble Flint Tiffany M and Flint Derek
Bought by
Hud
Purchase Details
Closed on
Mar 7, 2003
Sold by
Flint Derek
Bought by
Tribble Flint Tiffany M
Purchase Details
Closed on
Mar 30, 1998
Sold by
Hoekstra James E and Hoekstra Patricia Helen
Bought by
Hoekstra Ii James E
Home Financials for this Owner
Home Financials are based on the most recent Mortgage that was taken out on this home.
Original Mortgage
$52,800
Interest Rate
7.09%
Purchase Details
Closed on
Mar 25, 1998
Sold by
Estate Of Jo Ann Hoekstra
Bought by
Hoekstra James Edward
Home Financials for this Owner
Home Financials are based on the most recent Mortgage that was taken out on this home.
Original Mortgage
$52,800
Interest Rate
7.09%
Create a Home Valuation Report for This Property
The Home Valuation Report is an in-depth analysis detailing your home's value as well as a comparison with similar homes in the area
Home Values in the Area
Average Home Value in this Area
Purchase History
| Date | Buyer | Sale Price | Title Company |
|---|---|---|---|
| Sopapia Pratchaya | $20,000 | None Available | |
| Hud | $46,000 | None Available | |
| Tribble Flint Tiffany M | -- | -- | |
| Integrity Real Estate Solutions Llc | -- | -- | |
| Hoekstra Ii James E | $48,000 | -- | |
| Hoekstra James Edward | -- | -- |
Source: Public Records
Mortgage History
| Date | Status | Borrower | Loan Amount |
|---|---|---|---|
| Previous Owner | Hoekstra Ii James E | $52,800 |
Source: Public Records
Tax History
| Year | Tax Paid | Tax Assessment Tax Assessment Total Assessment is a certain percentage of the fair market value that is determined by local assessors to be the total taxable value of land and additions on the property. | Land | Improvement |
|---|---|---|---|---|
| 2025 | $3,426 | $53,551 | $7,746 | $45,805 |
| 2024 | $3,422 | $53,551 | $7,746 | $45,805 |
| 2023 | $3,428 | $53,551 | $7,746 | $45,805 |
| 2022 | $1,555 | $21,557 | $7,697 | $13,860 |
| 2021 | $1,518 | $21,557 | $7,697 | $13,860 |
| 2020 | $1,522 | $21,557 | $7,697 | $13,860 |
| 2019 | $1,520 | $19,597 | $6,997 | $12,600 |
| 2018 | $1,521 | $19,597 | $6,997 | $12,600 |
| 2017 | $1,464 | $19,597 | $6,997 | $12,600 |
| 2016 | $1,524 | $19,923 | $7,480 | $12,443 |
| 2015 | $1,364 | $19,923 | $7,480 | $12,443 |
| 2014 | $1,372 | $19,923 | $7,480 | $12,443 |
| 2013 | $1,581 | $22,638 | $8,498 | $14,140 |
Source: Public Records
Map
Nearby Homes
- 1318 Beech Ave
- 1613 Wyoming Ave
- 1705 Wyoming Ave
- 1440 Manss Ave
- 1710 Wyoming Ave
- 4033 W Liberty St
- 3744 Mayfield Ave
- 3742 Mayfield Ave
- 1634 Dewey Ave
- 1647 Dewey Ave
- 2403 Glenway Ave
- 1222 Dewey Ave
- 4000 Akochia Ave
- 1812 Quebec Rd
- 1113 Gilsey Ave
- 1110 Winfield Ave
- 1011 Seton Ave
- 2024 Sunset Ave
- 952 Seton Ave
- 963 Oakland Ave
- 3827 Davoran Ave
- 1342 Beech Ave
- 3827 Davoran St
- 1641 Minion Ave
- 1332 Beech Ave
- 3825 Davoran Ave
- 1637 Minion Ave
- 1341 Beech Ave
- 1345 Beech Ave
- 1337 Beech Ave
- 1349 Beech Ave
- 1400 Beech Ave
- 1328 Beech Ave
- 3828 Davoran Ave
- 1335 Beech Ave
- 3826 Davoran Ave
- 1324 Beech Ave
- 1401 Beech Ave
- 1629 Minion Ave
- 1331 Beech Ave
Your Personal Tour Guide
Ask me questions while you tour the home.