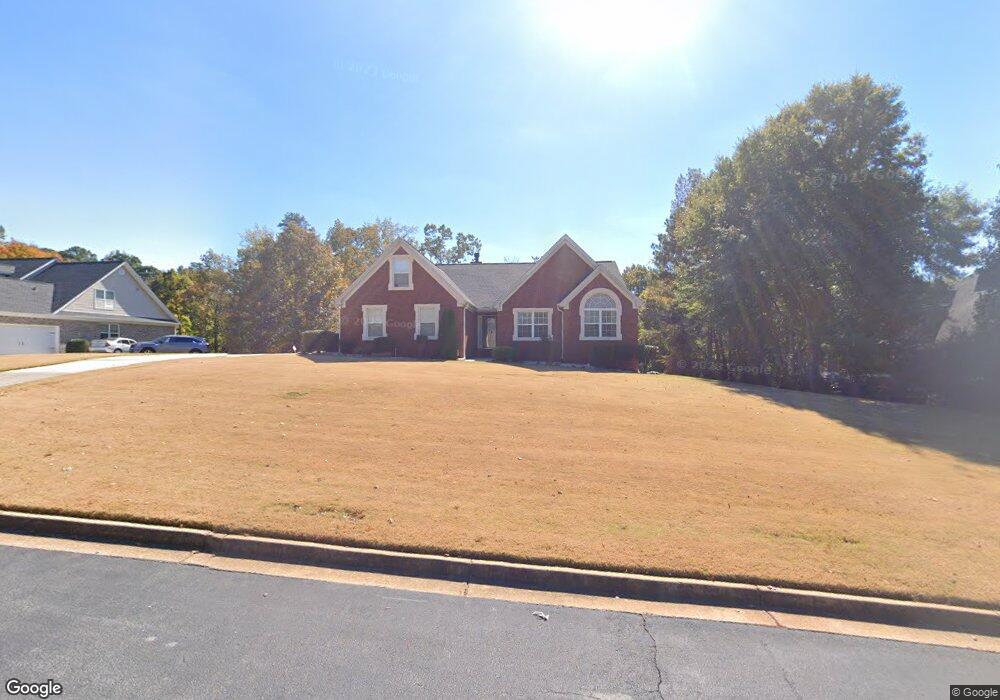
1338 Foxglove Ln SW Unit 37 Conyers, GA 30094
Estimated Value: $367,738 - $475,000
3
Beds
2
Baths
2,572
Sq Ft
$163/Sq Ft
Est. Value
About This Home
This home is located at 1338 Foxglove Ln SW Unit 37, Conyers, GA 30094 and is currently estimated at $419,935, approximately $163 per square foot. 1338 Foxglove Ln SW Unit 37 is a home located in Rockdale County with nearby schools including Lorraine Elementary School, Gen. Ray Davis Middle School, and Salem High School.
Ownership History
Date
Name
Owned For
Owner Type
Purchase Details
Closed on
Jan 27, 2017
Sold by
Windley Billy J
Bought by
Swift Kent M and Swift Lillian
Current Estimated Value
Home Financials for this Owner
Home Financials are based on the most recent Mortgage that was taken out on this home.
Original Mortgage
$170,000
Outstanding Balance
$141,223
Interest Rate
4.32%
Mortgage Type
New Conventional
Estimated Equity
$278,712
Purchase Details
Closed on
Jul 21, 2006
Sold by
Riggle Robert S and Riggle Amber W
Bought by
Windley Billy J and Windley Vanessa
Home Financials for this Owner
Home Financials are based on the most recent Mortgage that was taken out on this home.
Original Mortgage
$264,000
Interest Rate
7.37%
Mortgage Type
Stand Alone Second
Purchase Details
Closed on
Sep 25, 2003
Sold by
B & S Custom Homes
Bought by
Riggle Amber W
Home Financials for this Owner
Home Financials are based on the most recent Mortgage that was taken out on this home.
Original Mortgage
$202,410
Interest Rate
7.5%
Mortgage Type
New Conventional
Create a Home Valuation Report for This Property
The Home Valuation Report is an in-depth analysis detailing your home's value as well as a comparison with similar homes in the area
Home Values in the Area
Average Home Value in this Area
Purchase History
| Date | Buyer | Sale Price | Title Company |
|---|---|---|---|
| Swift Kent M | $189,000 | -- | |
| Windley Billy J | $264,000 | -- | |
| Riggle Amber W | $224,900 | -- |
Source: Public Records
Mortgage History
| Date | Status | Borrower | Loan Amount |
|---|---|---|---|
| Open | Swift Kent M | $170,000 | |
| Previous Owner | Windley Billy J | $264,000 | |
| Previous Owner | Riggle Amber W | $202,410 |
Source: Public Records
Tax History Compared to Growth
Tax History
| Year | Tax Paid | Tax Assessment Tax Assessment Total Assessment is a certain percentage of the fair market value that is determined by local assessors to be the total taxable value of land and additions on the property. | Land | Improvement |
|---|---|---|---|---|
| 2024 | $3,723 | $175,600 | $33,120 | $142,480 |
| 2023 | $2,440 | $132,680 | $27,520 | $105,160 |
| 2022 | $2,260 | $113,400 | $22,800 | $90,600 |
| 2021 | $2,416 | $113,400 | $22,800 | $90,600 |
| 2020 | $1,909 | $93,680 | $14,920 | $78,760 |
| 2019 | $1,885 | $91,040 | $12,280 | $78,760 |
| 2018 | $1,418 | $83,400 | $10,560 | $72,840 |
| 2017 | $3,688 | $80,160 | $12,520 | $67,640 |
| 2016 | $1,692 | $72,040 | $11,160 | $60,880 |
| 2015 | $1,695 | $72,040 | $11,160 | $60,880 |
| 2014 | $1,518 | $72,040 | $11,160 | $60,880 |
| 2013 | -- | $87,760 | $20,000 | $67,760 |
Source: Public Records
Map
Nearby Homes
- 1433 Cotton Trail SW
- 1709 Elizabeth Ct SW
- 5162 Kurt Ln SW
- 1821 Holmes Dr SW
- 1765 Elizabeth Ct SW
- 1740 Elizabeth Ct SW
- 1840 Holmsey Cir
- 1721 Windsong Dr SW
- 1590 Colonial South Dr SW
- 1769 Elizabeth Ct SW
- 5170 Paul Cir SW
- 2301 Mallory Cir Unit 2
- 2206 Crescent Walk
- 5190 Paul Cir SW
- 5262 E Shore Dr SW
- 4970 Hull Rd SE
- 5515 Deer Run Dr SW
- 5142 Fawn Ln SW
- 1459 Highway 212 SW
- 2104 Crest Wood Dr
- 1338 Foxglove Ln SW
- 1334 Foxglove Ln SW
- 1342 Foxglove Ln SW
- 1400 Cotton Tr SW
- 1400 Cotton Tail Dr
- 1330 Foxglove Ln SW
- 1337 Foxglove Ln SW
- 1400 Cotton Trail SW
- 1341 Foxglove Ln SW
- 1345 Foxglove Ln SW
- 1349 Foxglove Ln SW
- 0 Foxglove Ln SW Unit 8608776
- 0 Foxglove Ln SW Unit 8198430
- 0 Foxglove Ln SW Unit 7282504
- 0 Foxglove Ln SW
- 1327 Foxglove Ln SW
- 1326 Foxglove Ln SW
- 1404 Cotton Trail SW
- 1729 Holmes Dr SW
- 1405 Cotton Trail SW