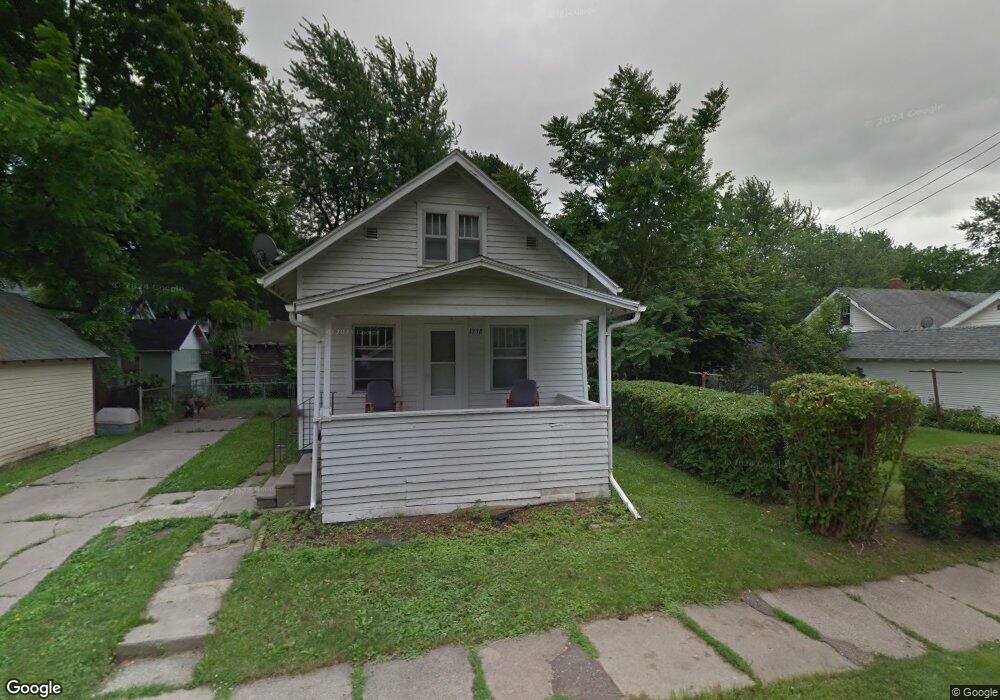
1338 Gray St Lansing, MI 48912
Potter Walsh NeighborhoodEstimated Value: $71,000 - $92,000
3
Beds
1
Bath
830
Sq Ft
$94/Sq Ft
Est. Value
About This Home
This home is located at 1338 Gray St, Lansing, MI 48912 and is currently estimated at $78,128, approximately $94 per square foot. 1338 Gray St is a home located in Ingham County with nearby schools including Lyons Elementary School, Pattengill Academy, and Eastern High School.
Ownership History
Date
Name
Owned For
Owner Type
Purchase Details
Closed on
Oct 16, 2020
Sold by
Ingham County Treasurer
Bought by
Creagh Jordan
Current Estimated Value
Purchase Details
Closed on
Oct 12, 2004
Sold by
Lehman Jeffrey A and Lehman Evivian L
Bought by
Jvl Properties Llc
Purchase Details
Closed on
Apr 29, 2004
Sold by
Jvl Properties Llc
Bought by
Lehman Jeff
Home Financials for this Owner
Home Financials are based on the most recent Mortgage that was taken out on this home.
Original Mortgage
$47,200
Interest Rate
4.52%
Mortgage Type
Purchase Money Mortgage
Purchase Details
Closed on
Nov 26, 2003
Sold by
Lehman Jeffrey A and Lehman Evivian L
Bought by
Jvl Properties Llc
Purchase Details
Closed on
May 5, 2003
Sold by
Dush George E and Dush Helen M
Bought by
Lehman Jeffrey A
Home Financials for this Owner
Home Financials are based on the most recent Mortgage that was taken out on this home.
Original Mortgage
$43,650
Interest Rate
5.9%
Mortgage Type
Purchase Money Mortgage
Create a Home Valuation Report for This Property
The Home Valuation Report is an in-depth analysis detailing your home's value as well as a comparison with similar homes in the area
Home Values in the Area
Average Home Value in this Area
Purchase History
We collect this data history from publicly available records. To have your information removed, we recommend requesting removal directly through your county’s website.
| Date | Buyer | Sale Price | Title Company |
|---|---|---|---|
| Creagh Jordan | -- | None Available | |
| Jvl Properties Llc | -- | -- | |
| Lehman Jeff | -- | 1St Michigan Title | |
| Jvl Properties Llc | -- | -- | |
| Lehman Jeffrey A | $48,500 | Multiple |
Source: Public Records
Mortgage History
We collect this data history from publicly available records. To have your information removed, we recommend requesting removal directly through your county’s website.
| Date | Status | Borrower | Loan Amount |
|---|---|---|---|
| Previous Owner | Lehman Jeff | $47,200 | |
| Previous Owner | Lehman Jeffrey A | $43,650 |
Source: Public Records
Tax History
| Year | Tax Paid | Tax Assessment Tax Assessment Total Assessment is a certain percentage of the fair market value that is determined by local assessors to be the total taxable value of land and additions on the property. | Land | Improvement |
|---|---|---|---|---|
| 2025 | $1,534 | $35,000 | $1,800 | $33,200 |
| 2024 | $15 | $28,100 | $1,800 | $26,300 |
| 2023 | $1,740 | $22,700 | $1,800 | $20,900 |
| 2022 | $1,591 | $21,600 | $1,700 | $19,900 |
| 2021 | $1,755 | $18,700 | $1,500 | $17,200 |
| 2020 | $1,342 | $17,400 | $1,500 | $15,900 |
| 2019 | $2,298 | $16,700 | $1,500 | $15,200 |
| 2018 | $1,230 | $15,500 | $1,500 | $14,000 |
| 2017 | $1,182 | $15,500 | $1,500 | $14,000 |
| 2016 | $2,119 | $15,200 | $1,500 | $13,700 |
| 2015 | $2,119 | $14,700 | $3,059 | $11,641 |
| 2014 | $2,119 | $14,800 | $3,059 | $11,741 |
Source: Public Records
Map
Nearby Homes
- 942 Dakin St
- 929 Dakin St
- 1004 Mccullough St
- 1240 Climax St
- 910 S Holmes St
- 1245 Parkview St
- 612 Lathrop St
- 1133 Lathrop St
- 619 Lathrop St
- 1111 Walsh St
- 537 Lathrop St
- 1209 Lathrop St
- 1038 Morgan St
- 509 Clifford St
- 520 S Holmes St
- 519 Lathrop St
- 1204 Shepard St
- 710 Leslie St
- 619 Shepard St
- 1006 S Pennsylvania Ave
Your Personal Tour Guide
Ask me questions while you tour the home.