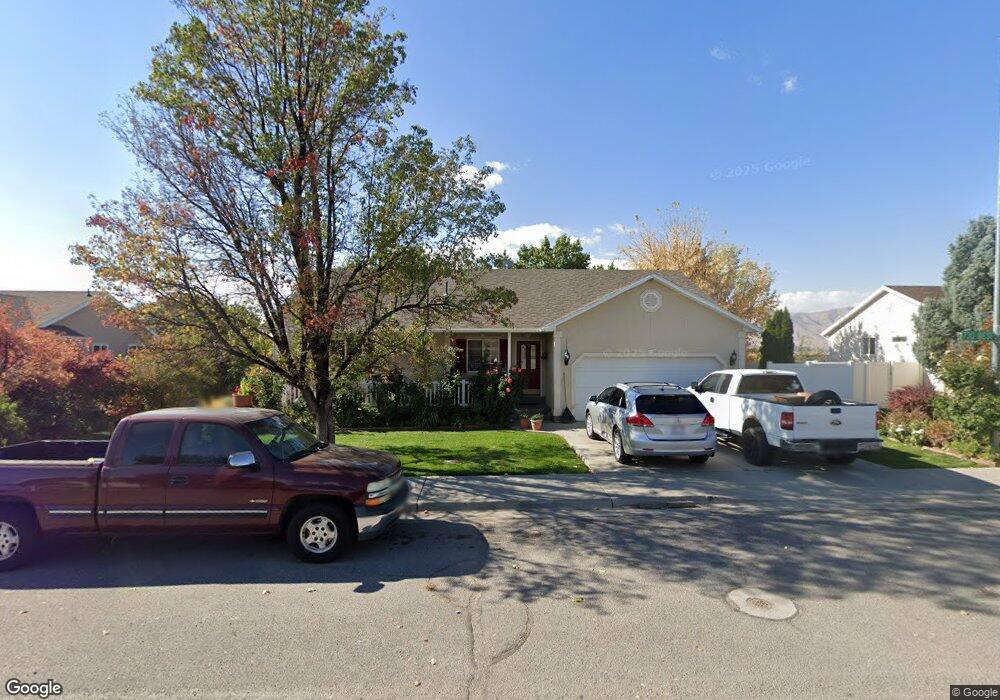
1338 S 730 W Payson, UT 84651
Estimated Value: $474,000 - $506,000
5
Beds
3
Baths
2,548
Sq Ft
$194/Sq Ft
Est. Value
About This Home
This home is located at 1338 S 730 W, Payson, UT 84651 and is currently estimated at $494,921, approximately $194 per square foot. 1338 S 730 W is a home located in Utah County with nearby schools including Wilson Elementary School, Payson Junior High School, and Payson High School.
Ownership History
Date
Name
Owned For
Owner Type
Purchase Details
Closed on
Apr 25, 2007
Sold by
Esparza Arnulfo
Bought by
Esparza Arnulfo and Esparza Teresa
Current Estimated Value
Home Financials for this Owner
Home Financials are based on the most recent Mortgage that was taken out on this home.
Original Mortgage
$208,000
Outstanding Balance
$126,865
Interest Rate
6.31%
Mortgage Type
New Conventional
Estimated Equity
$368,056
Purchase Details
Closed on
May 25, 2004
Sold by
Bentley Darin Jay and Bentley Teree Nicole
Bought by
Esparza Arnulfo
Home Financials for this Owner
Home Financials are based on the most recent Mortgage that was taken out on this home.
Original Mortgage
$146,400
Interest Rate
5%
Mortgage Type
Purchase Money Mortgage
Purchase Details
Closed on
Nov 12, 1999
Sold by
Country Living Development Inc
Bought by
Bentley Darin Jay and Bentley Teree Nicole
Create a Home Valuation Report for This Property
The Home Valuation Report is an in-depth analysis detailing your home's value as well as a comparison with similar homes in the area
Home Values in the Area
Average Home Value in this Area
Purchase History
| Date | Buyer | Sale Price | Title Company |
|---|---|---|---|
| Esparza Arnulfo | -- | Provo Land Title Company | |
| Esparza Arnulfo | -- | Inwest Title Services Inc | |
| Bentley Darin Jay | -- | Mountain West Title Co |
Source: Public Records
Mortgage History
| Date | Status | Borrower | Loan Amount |
|---|---|---|---|
| Open | Esparza Arnulfo | $208,000 | |
| Closed | Esparza Arnulfo | $146,400 | |
| Closed | Esparza Arnulfo | $36,600 |
Source: Public Records
Tax History Compared to Growth
Tax History
| Year | Tax Paid | Tax Assessment Tax Assessment Total Assessment is a certain percentage of the fair market value that is determined by local assessors to be the total taxable value of land and additions on the property. | Land | Improvement |
|---|---|---|---|---|
| 2025 | $2,405 | $261,580 | $162,900 | $312,700 |
| 2024 | $2,405 | $244,750 | $0 | $0 |
| 2023 | $2,425 | $247,445 | $0 | $0 |
| 2022 | $2,384 | $239,305 | $0 | $0 |
| 2021 | $2,018 | $324,800 | $106,900 | $217,900 |
| 2020 | $1,912 | $301,200 | $97,200 | $204,000 |
| 2019 | $1,761 | $284,400 | $80,400 | $204,000 |
| 2018 | $1,654 | $257,400 | $70,400 | $187,000 |
| 2017 | $1,551 | $129,800 | $0 | $0 |
| 2016 | $1,486 | $123,585 | $0 | $0 |
| 2015 | $1,436 | $118,580 | $0 | $0 |
| 2014 | $1,311 | $109,010 | $0 | $0 |
Source: Public Records
Map
Nearby Homes
- 802 Brookside Ct
- 1163 S 730 W
- 1172 S 880 W
- 588 W 1450 S
- 1161 Utah 198
- 1087 S 680 W
- 1002 W Temple Rim Ln
- 1116 W 1290 S
- 1579 S 910 W
- 1128 W 1150 S Unit 9
- 598 W Saddlebrook Dr
- 1216 S 1150 W Unit 19
- 1592 S 790 W
- 1192 W 1130 St S Unit 202
- 1597 S 1100 W
- 1605 S 1100 W
- 1733 S 1100 W Unit 12
- 1763 S 1100 W Unit 14
- 1408 S 30 E
- 32 E 1690 S