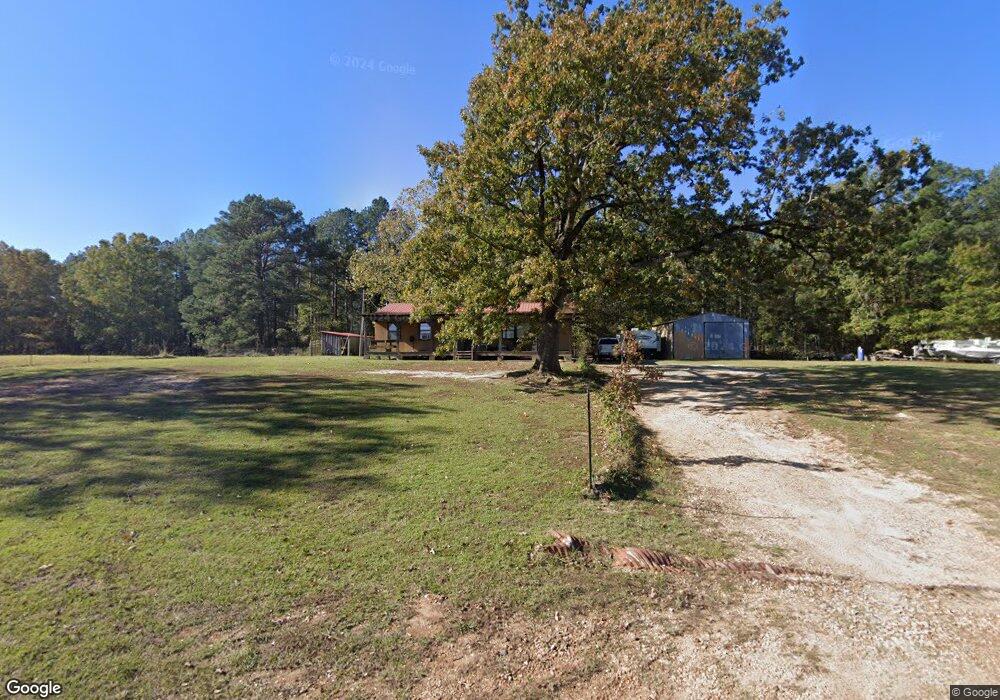
1338 Toro Church Rd Florien, LA 71429
Estimated Value: $93,000 - $196,000
--
Bed
--
Bath
1,600
Sq Ft
$79/Sq Ft
Est. Value
About This Home
This home is located at 1338 Toro Church Rd, Florien, LA 71429 and is currently estimated at $127,171, approximately $79 per square foot. 1338 Toro Church Rd is a home located in Sabine Parish.
Ownership History
Date
Name
Owned For
Owner Type
Purchase Details
Closed on
Mar 22, 2022
Sold by
Rushing Elizabeth M
Bought by
Landry Bryan N
Current Estimated Value
Home Financials for this Owner
Home Financials are based on the most recent Mortgage that was taken out on this home.
Original Mortgage
$74,659
Outstanding Balance
$69,942
Interest Rate
4.16%
Mortgage Type
FHA
Estimated Equity
$57,229
Purchase Details
Closed on
Jun 26, 2015
Sold by
Enterkin Michael Lynn
Bought by
Rushing Elizabeth M
Home Financials for this Owner
Home Financials are based on the most recent Mortgage that was taken out on this home.
Original Mortgage
$74,277
Interest Rate
3.91%
Mortgage Type
New Conventional
Purchase Details
Closed on
Jul 31, 2006
Sold by
Curtis Grover Dale and Curtis Shonda Anne Erwin
Bought by
Enterkin Michael Lynn and Enterkin Rachel
Home Financials for this Owner
Home Financials are based on the most recent Mortgage that was taken out on this home.
Original Mortgage
$79,900
Interest Rate
6.78%
Mortgage Type
New Conventional
Create a Home Valuation Report for This Property
The Home Valuation Report is an in-depth analysis detailing your home's value as well as a comparison with similar homes in the area
Home Values in the Area
Average Home Value in this Area
Purchase History
| Date | Buyer | Sale Price | Title Company |
|---|---|---|---|
| Landry Bryan N | -- | None Listed On Document | |
| Rushing Elizabeth M | $73,000 | None Available | |
| Enterkin Michael Lynn | $79,900 | None Available |
Source: Public Records
Mortgage History
| Date | Status | Borrower | Loan Amount |
|---|---|---|---|
| Open | Landry Bryan N | $74,659 | |
| Previous Owner | Rushing Elizabeth M | $74,277 | |
| Previous Owner | Enterkin Michael Lynn | $79,900 |
Source: Public Records
Tax History Compared to Growth
Tax History
| Year | Tax Paid | Tax Assessment Tax Assessment Total Assessment is a certain percentage of the fair market value that is determined by local assessors to be the total taxable value of land and additions on the property. | Land | Improvement |
|---|---|---|---|---|
| 2024 | $46 | $8,067 | $1,932 | $6,135 |
| 2023 | $161 | $9,451 | $1,832 | $7,619 |
| 2022 | $793 | $9,451 | $1,832 | $7,619 |
| 2021 | $853 | $9,451 | $1,832 | $7,619 |
| 2020 | $864 | $9,451 | $1,832 | $7,619 |
| 2019 | $857 | $9,445 | $1,832 | $7,613 |
| 2018 | $742 | $7,840 | $630 | $7,210 |
| 2017 | $747 | $7,840 | $630 | $7,210 |
| 2016 | $738 | $7,840 | $630 | $7,210 |
| 2015 | $33 | $7,840 | $630 | $7,210 |
| 2014 | -- | $7,840 | $630 | $7,210 |
Source: Public Records
Map
Nearby Homes
- 50 Paradise Ln
- 380 Arnold Dowden Rd
- 527 Park Rd
- 196 Killin Time Dr Unit 39
- 257 Killin Time Dr Unit 15
- 138 Killin Time Dr Unit 42
- 89 Killin Time Dr Unit 7
- 353 Killin Time Dr Unit 21
- 9 Killin Time Dr Unit 1
- 337 Killin Time Dr Unit 20
- 322 Killin Time Dr Unit 34
- 167 Killin Time Dr Unit 11
- 034 Wilderness Trail
- 272 Killin Time Dr Unit 36
- 141 Killin Time Dr Unit 10
- 231 Killin Time Dr Unit 14
- 174 Killin Time Dr Unit 40
- 291 Killin Time Dr Unit 18
- 283 Killin Time Dr Unit 17
- 315 Killin Time Dr Unit 19