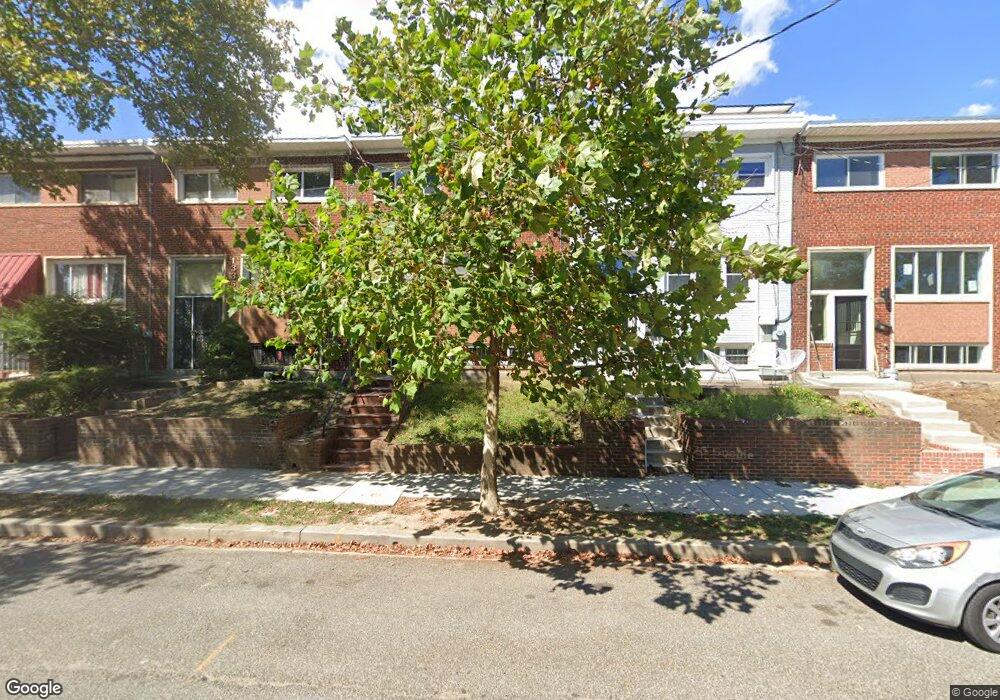
1338 W St NE Washington, DC 20018
Brentwood NeighborhoodEstimated Value: $450,499 - $507,000
3
Beds
2
Baths
1,120
Sq Ft
$420/Sq Ft
Est. Value
About This Home
This home is located at 1338 W St NE, Washington, DC 20018 and is currently estimated at $470,500, approximately $420 per square foot. 1338 W St NE is a home located in District of Columbia with nearby schools including Langdon Elementary School, McKinley Middle School, and Dunbar High School.
Ownership History
Date
Name
Owned For
Owner Type
Purchase Details
Closed on
Oct 29, 1996
Sold by
One Piney Grove Investment Cor
Bought by
Mccain Angela A
Current Estimated Value
Home Financials for this Owner
Home Financials are based on the most recent Mortgage that was taken out on this home.
Original Mortgage
$91,500
Outstanding Balance
$7,871
Interest Rate
8.22%
Mortgage Type
FHA
Estimated Equity
$462,629
Purchase Details
Closed on
Mar 27, 1996
Sold by
Fleet Fin Inc
Bought by
One Piney Grove Investment Cor
Home Financials for this Owner
Home Financials are based on the most recent Mortgage that was taken out on this home.
Original Mortgage
$52,000
Interest Rate
6.9%
Purchase Details
Closed on
Oct 12, 1995
Sold by
Moore Hattie M
Bought by
Fleet Finance Inc
Create a Home Valuation Report for This Property
The Home Valuation Report is an in-depth analysis detailing your home's value as well as a comparison with similar homes in the area
Home Values in the Area
Average Home Value in this Area
Purchase History
| Date | Buyer | Sale Price | Title Company |
|---|---|---|---|
| Mccain Angela A | -- | -- | |
| One Piney Grove Investment Cor | $49,000 | -- | |
| Fleet Finance Inc | $71,000 | -- |
Source: Public Records
Mortgage History
| Date | Status | Borrower | Loan Amount |
|---|---|---|---|
| Open | Mccain Angela A | $91,500 | |
| Previous Owner | One Piney Grove Investment Cor | $52,000 | |
| Closed | One Piney Grove Investment Cor | $30,000 |
Source: Public Records
Tax History
| Year | Tax Paid | Tax Assessment Tax Assessment Total Assessment is a certain percentage of the fair market value that is determined by local assessors to be the total taxable value of land and additions on the property. | Land | Improvement |
|---|---|---|---|---|
| 2025 | $4,376 | $514,840 | $308,710 | $206,130 |
| 2024 | $4,341 | $510,730 | $307,160 | $203,570 |
| 2023 | $4,231 | $497,740 | $299,450 | $198,290 |
| 2022 | $3,814 | $448,670 | $267,850 | $180,820 |
| 2021 | $3,724 | $438,120 | $263,870 | $174,250 |
| 2020 | $3,608 | $424,420 | $251,780 | $172,640 |
| 2019 | $3,271 | $384,830 | $232,100 | $152,730 |
| 2017 | $2,729 | $321,000 | $0 | $0 |
| 2016 | $2,368 | $278,550 | $0 | $0 |
Source: Public Records
Map
Nearby Homes
- 1328 W St NE
- 1333 Adams St NE Unit 2
- 1312 Adams St NE
- 2321 13th Place NE
- 1386 Bryant St NE Unit 103
- 2220 13th St NE
- 2238 15th St NE
- 1372 Bryant St NE Unit 2
- 1352 Bryant St NE Unit 1
- 2242 16th St NE
- 1332 Bryant St NE Unit 3
- 2219 16th St NE
- 1520 Montana Ave NE
- 1718 Montana Ave NE
- 1448 Channing St NE
- 2502 18th St NE
- 1236 Rhode Island Ave NE
- 1009 Rhode Island Ave NE Unit 1
- 1619 Evarts St NE
- 1516 Evarts St NE
- 1340 W St NE
- 1334 W St NE
- 1342 W St NE
- 1344 W St NE
- 1332 W St NE
- 1346 W St NE
- 1330 W St NE
- 1348 W St NE
- 1337 Adams St NE Unit 3
- 1337 Adams St NE
- 1337 Adams St NE
- 1337 Adams St NE
- 1337 Adams St NE
- 1337 Adams St NE
- 1337 Adams St NE Unit 4
- 1337 Adams St NE Unit 2
- 1333 Adams St NE
- 1333 Adams St NE
- 1333 Adams St NE
- 1333 Adams St NE
Your Personal Tour Guide
Ask me questions while you tour the home.