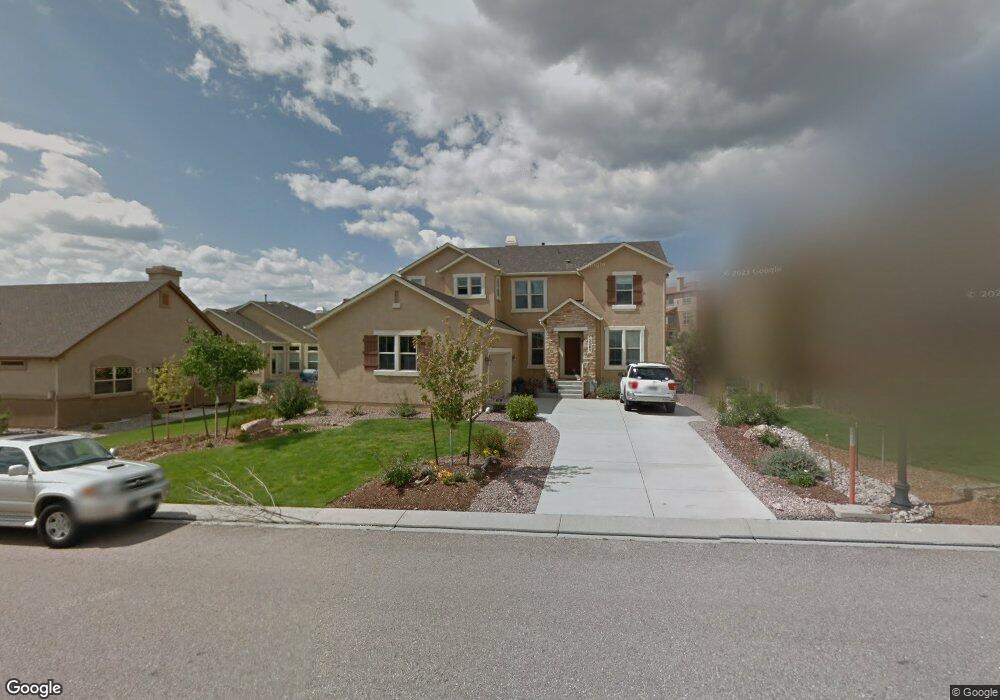
13383 Honey Run Way Colorado Springs, CO 80921
Flying Horse Ranch NeighborhoodEstimated Value: $802,000 - $876,000
5
Beds
4
Baths
2,773
Sq Ft
$298/Sq Ft
Est. Value
About This Home
This home is located at 13383 Honey Run Way, Colorado Springs, CO 80921 and is currently estimated at $826,439, approximately $298 per square foot. 13383 Honey Run Way is a home located in El Paso County with nearby schools including Discovery Canyon Campus Elementary School, Discovery Canyon Campus Middle School, and Discovery Canyon Campus High School.
Ownership History
Date
Name
Owned For
Owner Type
Purchase Details
Closed on
Aug 4, 2017
Sold by
Anti Michael E and Anti Anne L
Bought by
Fisher Adam and Fisher Kimberlee
Current Estimated Value
Home Financials for this Owner
Home Financials are based on the most recent Mortgage that was taken out on this home.
Original Mortgage
$472,213
Outstanding Balance
$393,386
Interest Rate
3.9%
Mortgage Type
VA
Estimated Equity
$433,053
Purchase Details
Closed on
Jul 27, 2009
Sold by
Gerelick Daniel S and Gerelick Paige M
Bought by
Anti Michael E and Anti Anne L
Home Financials for this Owner
Home Financials are based on the most recent Mortgage that was taken out on this home.
Original Mortgage
$320,000
Interest Rate
5.31%
Mortgage Type
Purchase Money Mortgage
Purchase Details
Closed on
Nov 15, 2006
Sold by
Keller Homes Inc
Bought by
Gerelick Daniel S and Gerelick Paige M
Home Financials for this Owner
Home Financials are based on the most recent Mortgage that was taken out on this home.
Original Mortgage
$375,000
Interest Rate
5.5%
Mortgage Type
Unknown
Purchase Details
Closed on
Jul 11, 2006
Sold by
Classic Development Flying Horse Llc
Bought by
Kf104-Fh Llc
Create a Home Valuation Report for This Property
The Home Valuation Report is an in-depth analysis detailing your home's value as well as a comparison with similar homes in the area
Home Values in the Area
Average Home Value in this Area
Purchase History
| Date | Buyer | Sale Price | Title Company |
|---|---|---|---|
| Fisher Adam | $475,000 | Unified Title Co | |
| Anti Michael E | $400,000 | Stewart Title | |
| Gerelick Daniel S | $522,610 | Land Title | |
| Kf104-Fh Llc | $95,600 | -- |
Source: Public Records
Mortgage History
| Date | Status | Borrower | Loan Amount |
|---|---|---|---|
| Open | Fisher Adam | $472,213 | |
| Previous Owner | Anti Michael E | $320,000 | |
| Previous Owner | Gerelick Daniel S | $375,000 |
Source: Public Records
Tax History Compared to Growth
Tax History
| Year | Tax Paid | Tax Assessment Tax Assessment Total Assessment is a certain percentage of the fair market value that is determined by local assessors to be the total taxable value of land and additions on the property. | Land | Improvement |
|---|---|---|---|---|
| 2025 | $5,210 | $55,380 | -- | -- |
| 2024 | $5,076 | $51,130 | $9,580 | $41,550 |
| 2022 | $4,268 | $38,210 | $9,040 | $29,170 |
| 2021 | $4,560 | $39,310 | $9,300 | $30,010 |
| 2020 | $4,729 | $39,200 | $9,300 | $29,900 |
| 2019 | $4,696 | $39,200 | $9,300 | $29,900 |
| 2018 | $3,896 | $32,270 | $7,490 | $24,780 |
| 2017 | $4,112 | $32,270 | $7,490 | $24,780 |
| 2016 | $3,817 | $31,990 | $7,240 | $24,750 |
| 2015 | $3,812 | $31,990 | $7,240 | $24,750 |
| 2014 | $3,499 | $29,350 | $7,240 | $22,110 |
Source: Public Records
Map
Nearby Homes
- 2374 Cinnabar Rd
- 2553 Cinnabar Rd
- 2351 Limerick Ct
- 13625 Random Ridge View
- 13525 Random Ridge View
- 13632 Stony Hill Point
- 14535 Roller Coaster Rd
- 13654 Fife Ct
- 2180 Rocking Horse Ct
- 1818 Redbank Dr
- 13274 Cake Bread Heights
- 2550 Mountain Pine Ln
- 13114 Cake Bread Heights
- 13901 Penfold Dr
- 12988 Cupcake Heights
- 13557 Pride Mountain Dr
- 13518 Pride Mountain Dr
- 12950 Penfold Dr
- 12810 Abert Way
- 13497 Pride Mountain Dr
- 13367 Honey Run Way
- 2368 Ledgewood Dr
- 2374 Ledgewood Dr
- 2362 Ledgewood Dr
- 2363 Rusty Ridge Ct
- 2339 Rusty Ridge Ct
- 2356 Ledgewood Dr
- 2405 Baystone Ct
- 2387 Rusty Ridge Ct
- 2406 Baystone Ct
- 2327 Rusty Ridge Ct
- 2419 Baystone Ct
- 2367 Ledgewood Dr
- 2373 Ledgewood Dr
- 2361 Ledgewood Dr
- 2315 Rusty Ridge Ct
- 2355 Ledgewood Dr
- 13352 Honey Run Way
- 2433 Baystone Ct
- 2403 Ledgewood Dr