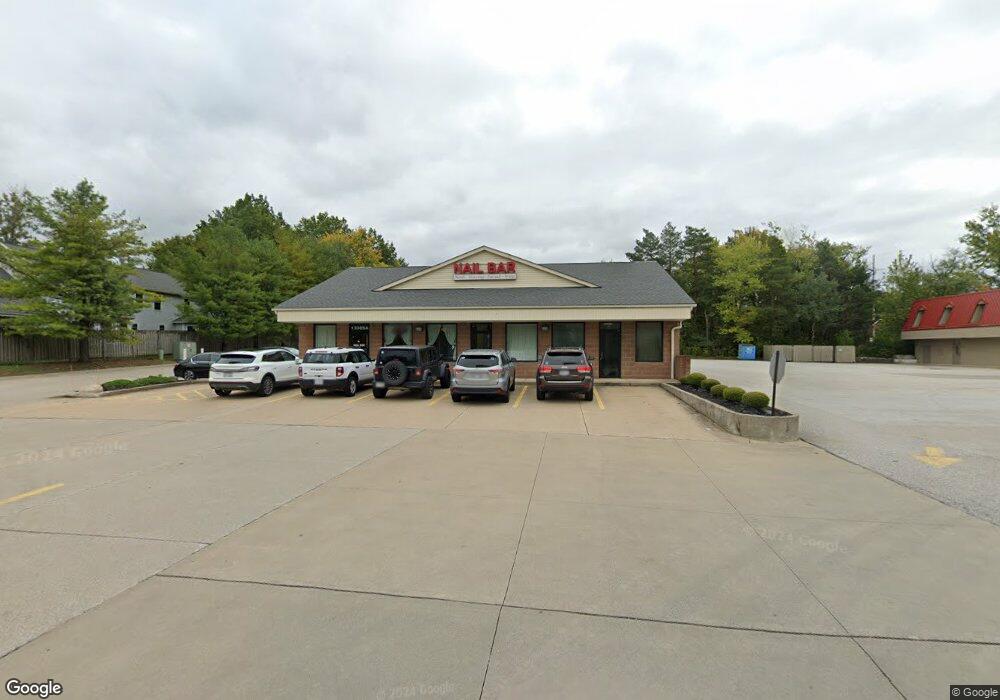
13385 W 130th St North Royalton, OH 44133
Estimated Value: $840,786
--
Bed
--
Bath
2,950
Sq Ft
$285/Sq Ft
Est. Value
About This Home
This home is located at 13385 W 130th St, North Royalton, OH 44133 and is currently estimated at $840,786, approximately $285 per square foot. 13385 W 130th St is a home located in Cuyahoga County with nearby schools including North Royalton Middle School and North Royalton High School.
Ownership History
Date
Name
Owned For
Owner Type
Purchase Details
Closed on
May 31, 2016
Sold by
Town Centre Car Wash Inc
Bought by
Cjq Capitals Llc
Current Estimated Value
Home Financials for this Owner
Home Financials are based on the most recent Mortgage that was taken out on this home.
Original Mortgage
$337,500
Outstanding Balance
$280,417
Interest Rate
5%
Mortgage Type
Commercial
Estimated Equity
$560,369
Purchase Details
Closed on
Oct 31, 2014
Sold by
Morar John and Morar Charlotte
Bought by
Town Centre Car Wash Inc
Purchase Details
Closed on
Dec 26, 1984
Bought by
Kendren Joseph L
Purchase Details
Closed on
Jul 18, 1984
Bought by
Ohio Sav Assoc
Purchase Details
Closed on
Mar 30, 1979
Bought by
North Royalton Investment Co
Purchase Details
Closed on
Jan 1, 1975
Bought by
Fisher Food Inc
Create a Home Valuation Report for This Property
The Home Valuation Report is an in-depth analysis detailing your home's value as well as a comparison with similar homes in the area
Home Values in the Area
Average Home Value in this Area
Purchase History
| Date | Buyer | Sale Price | Title Company |
|---|---|---|---|
| Cjq Capitals Llc | $437,500 | Attorney | |
| Town Centre Car Wash Inc | -- | Guardian Title | |
| Kendren Joseph L | -- | -- | |
| Ohio Sav Assoc | -- | -- | |
| North Royalton Investment Co | -- | -- | |
| Fisher Food Inc | -- | -- |
Source: Public Records
Mortgage History
| Date | Status | Borrower | Loan Amount |
|---|---|---|---|
| Open | Cjq Capitals Llc | $337,500 |
Source: Public Records
Tax History Compared to Growth
Tax History
| Year | Tax Paid | Tax Assessment Tax Assessment Total Assessment is a certain percentage of the fair market value that is determined by local assessors to be the total taxable value of land and additions on the property. | Land | Improvement |
|---|---|---|---|---|
| 2024 | $12,674 | $179,235 | $81,235 | $98,000 |
| 2023 | $11,699 | $160,760 | $86,100 | $74,660 |
| 2022 | $11,664 | $160,760 | $86,100 | $74,660 |
| 2021 | $11,912 | $160,760 | $86,100 | $74,660 |
| 2020 | $11,489 | $151,660 | $81,240 | $70,420 |
| 2019 | $11,177 | $433,300 | $232,100 | $201,200 |
| 2018 | $11,282 | $151,660 | $81,240 | $70,420 |
| 2017 | $10,870 | $139,900 | $71,470 | $68,430 |
| 2016 | $10,356 | $139,900 | $71,470 | $68,430 |
| 2015 | $10,376 | $139,900 | $71,470 | $68,430 |
| 2014 | $11,733 | $158,980 | $81,240 | $77,740 |
Source: Public Records
Map
Nearby Homes
- 12664 W 130th St
- 14835 Thornton Dr
- 11861 W Edgerton Rd
- 12199 Webster Rd
- 14236 Calderdale Ln
- 13861 Woodhawk Dr
- 14644 Baywood Ln
- 13475 Jacqueline Ct
- 13402 Bridgecreek Cir
- 14584 Baywood Ln
- 14557 Baywood Ln
- 0 Mill Hollow Ln Unit 5069608
- 11806 Harbour Light Dr Unit 1806
- 11650 Harbour Light Dr Unit 1650
- 11445 Harbour Light Dr
- 10700 Abbey Rd
- 14069 Basswood Cir
- 10560 Independence Dr Unit 25A
- 11432 Harbour Light Dr Unit 1
- 9841 Sunrise Blvd Unit P19
- 13371 W 130th St
- 12873 Royalton Rd
- 0 W 130th St
- 13000 Royalton Rd
- 12782 Royalton Rd
- 12802 Royalton Rd
- 13277 W 130th St
- 12762 Royalton Rd
- 13211 W 130th St
- 13462 W 130th St
- 12897 Royalton Rd
- 12601 Walnut Hill Dr
- 12601 Walnut Hill Dr
- 13525 Royalton Rd
- 13130 W 130th St
- 13130 W 130th St
- 13130 V/L 1 W 130th St
- 13051 W 130th St
- 13039 W 130th St
- 13027 W 130th St