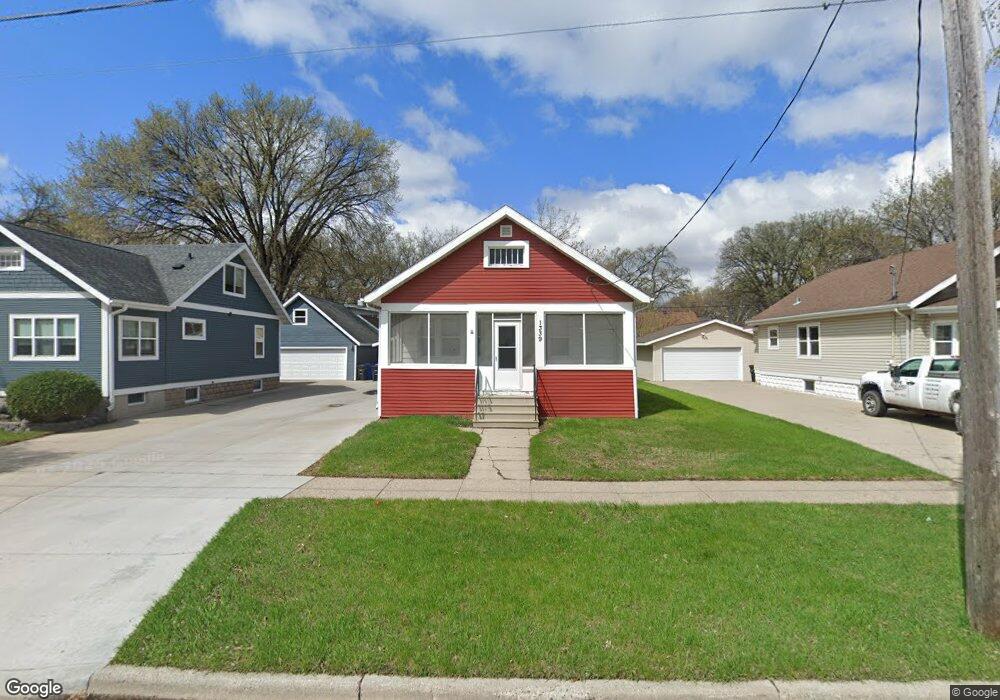
1339 5th St S Fargo, ND 58103
Clara Barton NeighborhoodEstimated Value: $166,000 - $211,000
Studio
--
Bath
816
Sq Ft
$235/Sq Ft
Est. Value
About This Home
This home is located at 1339 5th St S, Fargo, ND 58103 and is currently estimated at $191,759, approximately $234 per square foot. 1339 5th St S is a home located in Cass County with nearby schools including Clara Barton Elementary School, Carl Ben Eielson Middle School, and South High School.
Ownership History
Date
Name
Owned For
Owner Type
Purchase Details
Closed on
Jul 2, 2014
Sold by
Mcmanus Ryan and Ranck Heather
Bought by
Mcranck Properties 1339 Llc
Current Estimated Value
Purchase Details
Closed on
Nov 1, 2013
Sold by
Stephenson Richard H and Stephenson Daniel J
Bought by
Mcmanus Ryan and Ranck Heather
Home Financials for this Owner
Home Financials are based on the most recent Mortgage that was taken out on this home.
Original Mortgage
$64,000
Interest Rate
4.5%
Mortgage Type
New Conventional
Create a Home Valuation Report for This Property
The Home Valuation Report is an in-depth analysis detailing your home's value as well as a comparison with similar homes in the area
Home Values in the Area
Average Home Value in this Area
Purchase History
| Date | Buyer | Sale Price | Title Company |
|---|---|---|---|
| Mcranck Properties 1339 Llc | -- | None Available | |
| Mcmanus Ryan | $80,000 | Us Title |
Source: Public Records
Mortgage History
| Date | Status | Borrower | Loan Amount |
|---|---|---|---|
| Previous Owner | Mcmanus Ryan | $64,000 |
Source: Public Records
Tax History
| Year | Tax Paid | Tax Assessment Tax Assessment Total Assessment is a certain percentage of the fair market value that is determined by local assessors to be the total taxable value of land and additions on the property. | Land | Improvement |
|---|---|---|---|---|
| 2024 | $2,483 | $91,100 | $21,100 | $70,000 |
| 2023 | $2,311 | $85,150 | $21,100 | $64,050 |
| 2022 | $2,198 | $79,600 | $21,100 | $58,500 |
| 2021 | $1,923 | $70,750 | $22,300 | $48,450 |
| 2020 | $1,842 | $68,050 | $22,300 | $45,750 |
| 2019 | $1,712 | $63,600 | $12,400 | $51,200 |
| 2018 | $1,690 | $63,600 | $12,400 | $51,200 |
| 2017 | $1,625 | $61,750 | $12,400 | $49,350 |
| 2016 | $1,451 | $59,950 | $12,400 | $47,550 |
| 2015 | $1,452 | $56,250 | $9,300 | $46,950 |
| 2014 | $1,273 | $47,900 | $9,300 | $38,600 |
| 2013 | $70 | $47,900 | $9,300 | $38,600 |
Source: Public Records
Map
Nearby Homes
- 1348 6th St S
- 1311 5th St S
- 1502 8th St S
- 1020 6th St S
- 326 10th Ave S Unit 2
- 337 Elmwood Ave S
- 1550 8th St S
- 1301 10th St S
- 1534 10th St S
- 1119 Elm St S
- 1010 River Dr
- 817 9th St S
- 812 10th St S Unit B9
- 804 10th St S Unit A4
- 420 6th Ave S Unit 303
- 605 7th St S Unit 2
- 1208 2nd St S
- 1330 14th St S
- 1364 12th Ave S
- 502 8th St S Unit 5
Your Personal Tour Guide
Ask me questions while you tour the home.