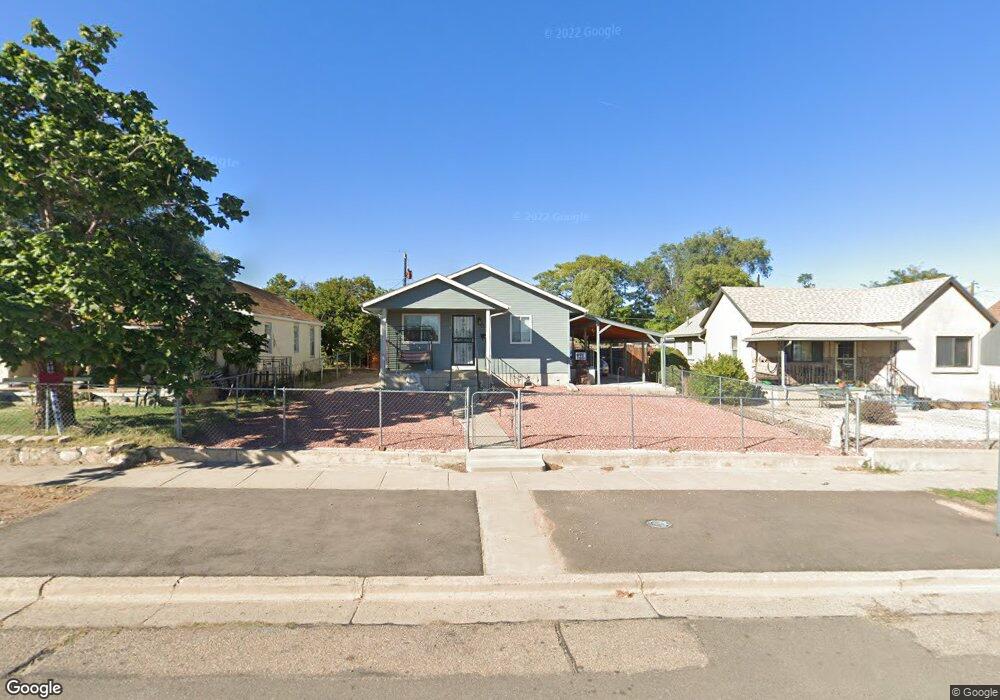
1339 E 2nd St Pueblo, CO 81001
Lower East Side NeighborhoodEstimated Value: $184,075 - $232,000
3
Beds
2
Baths
980
Sq Ft
$206/Sq Ft
Est. Value
About This Home
This home is located at 1339 E 2nd St, Pueblo, CO 81001 and is currently estimated at $202,269, approximately $206 per square foot. 1339 E 2nd St is a home located in Pueblo County with nearby schools including Bradford Elementary School, Risley International Academy of Innovation, and East High School.
Ownership History
Date
Name
Owned For
Owner Type
Purchase Details
Closed on
Dec 17, 2014
Sold by
Canas Madelena C
Bought by
Piganeli Madelina Cecilia
Current Estimated Value
Purchase Details
Closed on
Nov 14, 2002
Sold by
Canas Madelina C
Bought by
Canas Madelena C
Purchase Details
Closed on
Nov 29, 1994
Sold by
Neighborhood Housing Services
Bought by
Canas Madelina C
Purchase Details
Closed on
Aug 10, 1994
Sold by
Ripke William + Celia
Bought by
Neighborhood Housing Services
Purchase Details
Closed on
Dec 12, 1975
Bought by
Ripke William + Celia
Create a Home Valuation Report for This Property
The Home Valuation Report is an in-depth analysis detailing your home's value as well as a comparison with similar homes in the area
Home Values in the Area
Average Home Value in this Area
Purchase History
| Date | Buyer | Sale Price | Title Company |
|---|---|---|---|
| Piganeli Madelina Cecilia | -- | None Available | |
| Canas Madelena C | -- | -- | |
| Canas Madelina C | $54,000 | -- | |
| Neighborhood Housing Services | $2,500 | -- | |
| Ripke William + Celia | -- | -- |
Source: Public Records
Tax History
| Year | Tax Paid | Tax Assessment Tax Assessment Total Assessment is a certain percentage of the fair market value that is determined by local assessors to be the total taxable value of land and additions on the property. | Land | Improvement |
|---|---|---|---|---|
| 2024 | $446 | $8,810 | -- | -- |
| 2023 | $451 | $12,500 | $1,010 | $11,490 |
| 2022 | $529 | $10,450 | $400 | $10,050 |
| 2021 | $545 | $10,750 | $410 | $10,340 |
| 2020 | $343 | $10,010 | $410 | $9,600 |
| 2019 | $343 | $6,672 | $252 | $6,420 |
| 2018 | $245 | $5,304 | $253 | $5,051 |
| 2017 | $248 | $5,304 | $253 | $5,051 |
| 2016 | $227 | $4,928 | $280 | $4,648 |
| 2015 | $226 | $4,928 | $280 | $4,648 |
| 2014 | $239 | $5,195 | $280 | $4,915 |
Source: Public Records
Map
Nearby Homes
Your Personal Tour Guide
Ask me questions while you tour the home.