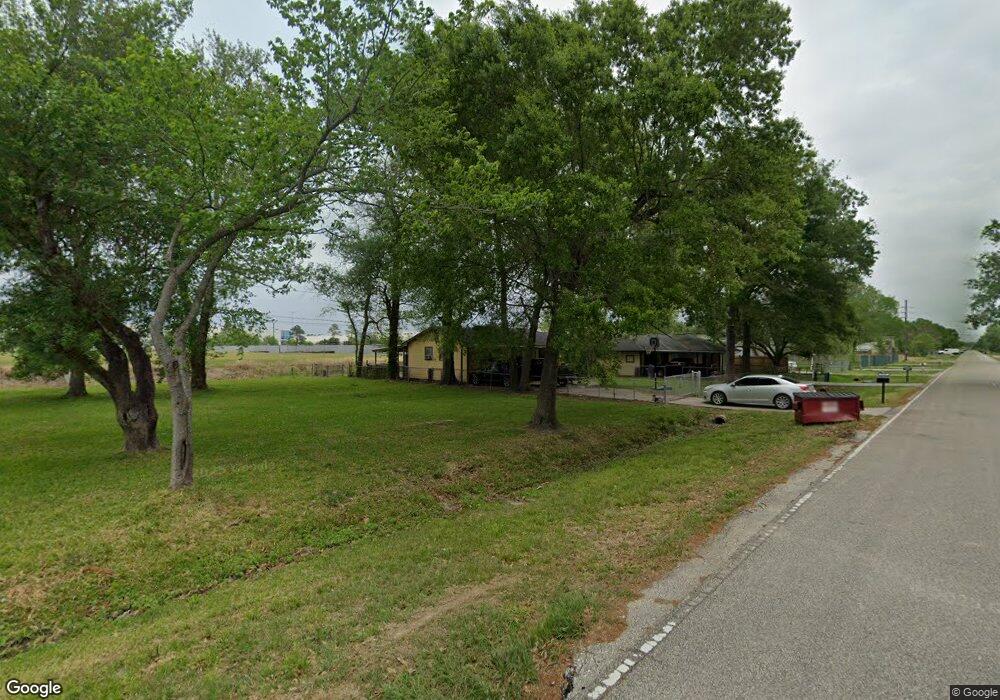
1339 Old Greens Rd Houston, TX 77032
Greenspoint NeighborhoodEstimated Value: $139,761 - $191,000
3
Beds
2
Baths
792
Sq Ft
$209/Sq Ft
Est. Value
About This Home
This home is located at 1339 Old Greens Rd, Houston, TX 77032 and is currently estimated at $165,440, approximately $208 per square foot. 1339 Old Greens Rd is a home located in Harris County with nearby schools including Calvert Elementary School, Nimitz Ninth Grade School, and Teague Middle School.
Ownership History
Date
Name
Owned For
Owner Type
Purchase Details
Closed on
Apr 27, 2006
Sold by
Fremont Investment & Loan
Bought by
Celis Armando and Celis Veronica
Current Estimated Value
Home Financials for this Owner
Home Financials are based on the most recent Mortgage that was taken out on this home.
Original Mortgage
$56,547
Outstanding Balance
$32,600
Interest Rate
6.32%
Mortgage Type
Fannie Mae Freddie Mac
Estimated Equity
$132,840
Purchase Details
Closed on
Sep 6, 2005
Sold by
Villasana Rebecca
Bought by
Fremont Investment & Loan
Purchase Details
Closed on
Jan 28, 2005
Sold by
Villasana Rebecca
Bought by
Perez Family Trust and Duncan Richard
Purchase Details
Closed on
Nov 20, 2003
Sold by
Allgood Gary
Bought by
Villasana Rebecca
Home Financials for this Owner
Home Financials are based on the most recent Mortgage that was taken out on this home.
Original Mortgage
$58,500
Interest Rate
8.75%
Mortgage Type
Purchase Money Mortgage
Purchase Details
Closed on
Aug 9, 2000
Sold by
Jim Walter Homes Inc
Bought by
Allgood Gary
Create a Home Valuation Report for This Property
The Home Valuation Report is an in-depth analysis detailing your home's value as well as a comparison with similar homes in the area
Home Values in the Area
Average Home Value in this Area
Purchase History
| Date | Buyer | Sale Price | Title Company |
|---|---|---|---|
| Celis Armando | -- | American Title Co | |
| Fremont Investment & Loan | $62,869 | -- | |
| Perez Family Trust | -- | -- | |
| Villasana Rebecca | -- | American Title Co | |
| Allgood Gary | -- | -- |
Source: Public Records
Mortgage History
| Date | Status | Borrower | Loan Amount |
|---|---|---|---|
| Open | Celis Armando | $56,547 | |
| Previous Owner | Villasana Rebecca | $58,500 |
Source: Public Records
Tax History Compared to Growth
Tax History
| Year | Tax Paid | Tax Assessment Tax Assessment Total Assessment is a certain percentage of the fair market value that is determined by local assessors to be the total taxable value of land and additions on the property. | Land | Improvement |
|---|---|---|---|---|
| 2025 | $653 | $114,550 | $42,840 | $71,710 |
| 2024 | $653 | $98,825 | $42,840 | $55,985 |
| 2023 | $653 | $77,337 | $16,200 | $61,137 |
| 2022 | $1,442 | $77,337 | $15,390 | $61,947 |
| 2021 | $1,378 | $63,957 | $15,390 | $48,567 |
| 2020 | $1,453 | $63,957 | $15,390 | $48,567 |
| 2019 | $1,443 | $60,640 | $15,066 | $45,574 |
| 2018 | $585 | $65,758 | $16,200 | $49,558 |
| 2017 | $1,490 | $65,758 | $16,200 | $49,558 |
| 2016 | $1,456 | $65,758 | $16,200 | $49,558 |
| 2015 | $1,028 | $58,418 | $16,200 | $42,218 |
| 2014 | $1,028 | $58,418 | $16,200 | $42,218 |
Source: Public Records
Map
Nearby Homes
- 1403 Old Greens Rd
- 0 W Hardy Rd Unit 90623815
- 810 Benmar Dr
- 1042 Tunell Ln
- 15607 Dowlwood Dr
- 17202 Imperial Valley Dr Unit 34
- 17202 Imperial Valley Dr Unit 28
- 17202 Imperial Valley Dr Unit 3
- 17210 Imperial Valley Dr Unit 13
- 17210 Imperial Valley Dr Unit 55
- 17210 Imperial Valley Dr Unit 61
- 17210 Imperial Valley Dr Unit 41
- 17210 Imperial Valley Dr Unit 2
- 17230 Imperial Valley Dr Unit 24
- 1003 Greens Rd
- 1114 Blackwood Ave
- tbd Hardy St
- 0 Hardy Rd 28B Hardy St
- 0 Hardy Rd
- 18302 Apple Bud Ct
- 1343 Old Greens Rd
- 1345 Old Greens Rd
- 1347 Old Greens Rd
- 1334 Old Greens Rd
- 1330 Old Greens Rd
- 1323 Old Greens Rd
- 1350 Old Greens Rd
- 1319 Old Greens Rd
- 1355 Old Greens Rd
- 1322 Old Greens Rd
- 1405 Old Greens Rd
- 1543 Old Greens Rd
- 1539 Old Greens Rd
- 1339 Greenoak Dr
- 1327 Greenoak Dr
- 1347 Greenoak Dr
- 1347 Greenoak Dr Unit 200
- 1347 Greenoak Dr Unit 101
- 1347 Greenoak Dr Unit c
- 1347 Greenoak Dr Unit 201