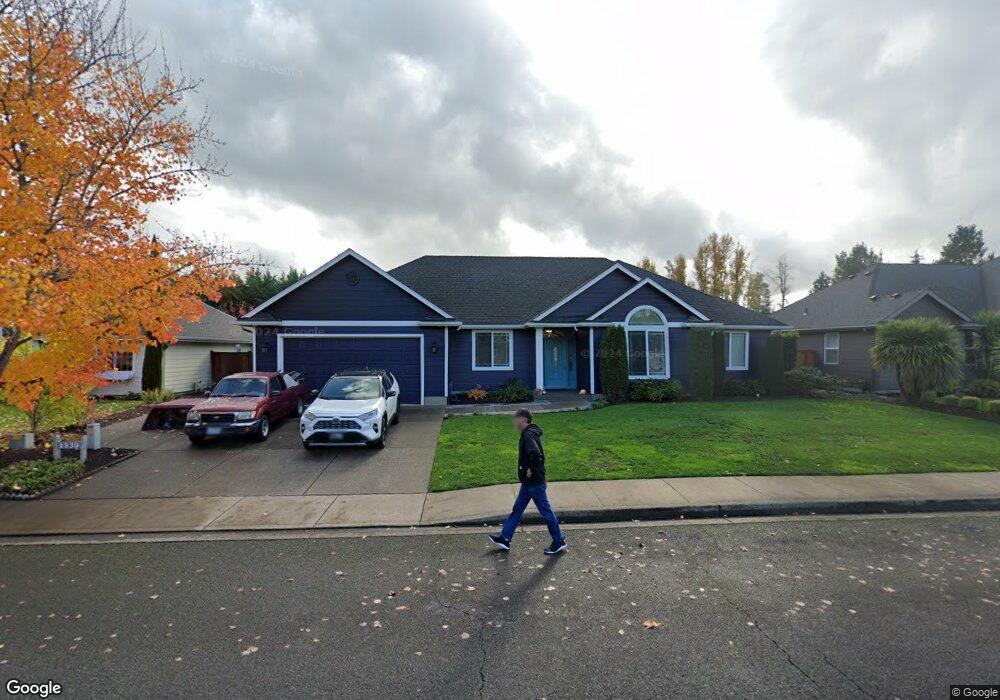
1339 SE Barberry Ave Dallas, OR 97338
Estimated Value: $555,528 - $602,000
3
Beds
2
Baths
2,090
Sq Ft
$274/Sq Ft
Est. Value
About This Home
This home is located at 1339 SE Barberry Ave, Dallas, OR 97338 and is currently estimated at $572,382, approximately $273 per square foot. 1339 SE Barberry Ave is a home located in Polk County with nearby schools including Whitworth Elementary School, Oakdale Heights Elementary School, and LaCreole Middle School.
Ownership History
Date
Name
Owned For
Owner Type
Purchase Details
Closed on
Sep 10, 2019
Sold by
Dodge Danny J
Bought by
Dodge Danny J and The Danny J Dodge Family Trust
Current Estimated Value
Purchase Details
Closed on
Jul 27, 2012
Sold by
Cleveland Rosalie E
Bought by
Dodge Danny J and Dodge Holly D
Home Financials for this Owner
Home Financials are based on the most recent Mortgage that was taken out on this home.
Original Mortgage
$204,800
Outstanding Balance
$141,742
Interest Rate
3.65%
Mortgage Type
New Conventional
Estimated Equity
$430,640
Purchase Details
Closed on
Aug 8, 2005
Sold by
Boswell Rodney A and Boswell Terry L
Bought by
Cleveland Steven L and Cleveland Rosalie E
Home Financials for this Owner
Home Financials are based on the most recent Mortgage that was taken out on this home.
Original Mortgage
$100,000
Interest Rate
5.48%
Mortgage Type
Fannie Mae Freddie Mac
Create a Home Valuation Report for This Property
The Home Valuation Report is an in-depth analysis detailing your home's value as well as a comparison with similar homes in the area
Home Values in the Area
Average Home Value in this Area
Purchase History
| Date | Buyer | Sale Price | Title Company |
|---|---|---|---|
| Dodge Danny J | -- | None Available | |
| Dodge Danny J | $256,000 | Ticor Title | |
| Cleveland Steven L | $265,250 | First American Title |
Source: Public Records
Mortgage History
| Date | Status | Borrower | Loan Amount |
|---|---|---|---|
| Open | Dodge Danny J | $204,800 | |
| Previous Owner | Cleveland Steven L | $100,000 |
Source: Public Records
Tax History Compared to Growth
Tax History
| Year | Tax Paid | Tax Assessment Tax Assessment Total Assessment is a certain percentage of the fair market value that is determined by local assessors to be the total taxable value of land and additions on the property. | Land | Improvement |
|---|---|---|---|---|
| 2025 | $3,346 | $244,320 | $82,480 | $161,840 |
| 2024 | $3,346 | $237,210 | $80,080 | $157,130 |
| 2023 | $3,218 | $230,310 | $77,750 | $152,560 |
| 2022 | $3,134 | $223,610 | $75,480 | $148,130 |
| 2021 | $3,047 | $217,100 | $73,280 | $143,820 |
| 2020 | $2,960 | $210,780 | $71,140 | $139,640 |
| 2019 | $2,875 | $204,650 | $69,060 | $135,590 |
| 2018 | $2,867 | $198,690 | $67,050 | $131,640 |
| 2017 | $2,754 | $192,910 | $65,100 | $127,810 |
| 2016 | $2,772 | $187,300 | $63,200 | $124,100 |
| 2015 | $2,733 | $181,850 | $61,360 | $120,490 |
| 2014 | $2,646 | $176,560 | $59,570 | $116,990 |
Source: Public Records
Map
Nearby Homes
- 1368 SE Barberry Ave
- 1237 SE Barberry Ave
- 599 SE Cooper St
- 1652 SE Academy St
- 1516 SE Miller Ave
- 1670 SE Academy St
- 500 SE Stafrin St
- 1779 SE Academy St
- 1620 SE Barberry Ave
- 1009 SE Academy St
- 764 SE Fowler St
- 1770 SE Miller Ave
- 425 SE Shetterly Dr
- 413 SE Shetterly Dr
- 363 SE Shetterly Dr
- 351 SE Shetterly Dr
- 347 SE Shetterly Dr
- 1677 SE Barberry Ave
- 1433 SE Hankel St
- 1355 SE Barberry Ave
- 1327 SE Barberry Ave
- 904 SE Grant Ct
- 904 SE Grant Ct Dallas Or 9
- 916 SE Grant Ct
- - SE Barberry Ave Unit 116
- - SE Barberry Ave Unit 111
- - SE Barberry Ave Unit 112
- - SE Barberry Ave Unit 113
- - SE Barberry Ave Unit 115
- - SE Barberry Ave Unit 117
- - SE Barberry Ave Unit 118
- - SE Barberry Ave Unit 120
- - SE Barberry Ave Unit 121
- - SE Barberry Ave
- 1342 SE Barberry Ave
- 905 SE Grant Ct
- 1379 SE Barberry Ave
- 1322 SE Barberry Ave
- 1226 SE Hawthorne Ave