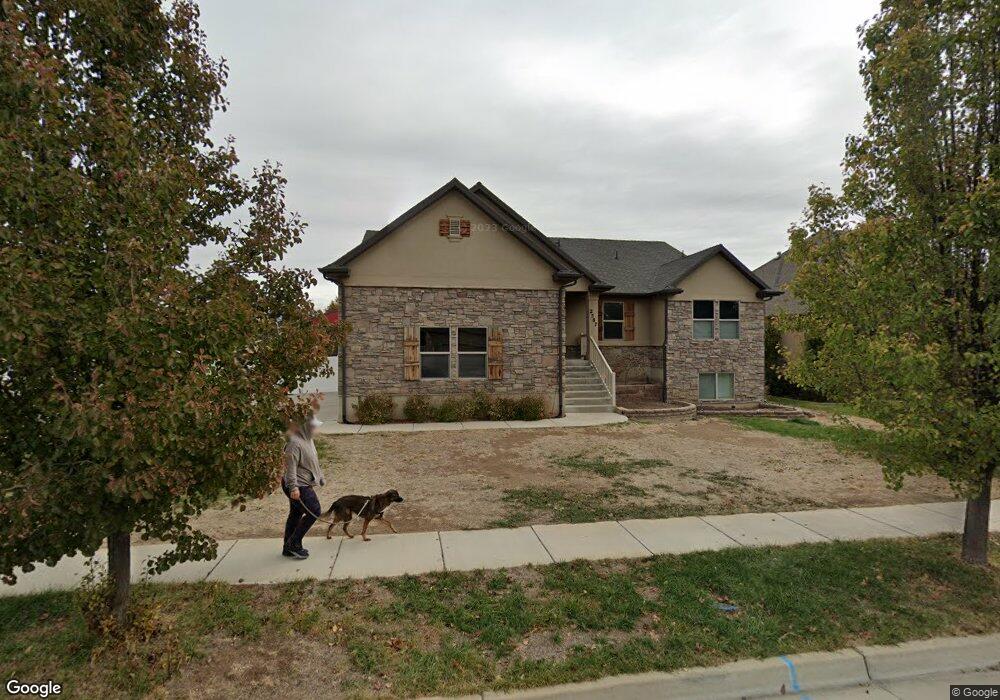
1339 W 2615 S Syracuse, UT 84075
Estimated Value: $927,000 - $1,205,987
4
Beds
3
Baths
2,772
Sq Ft
$395/Sq Ft
Est. Value
About This Home
This home is located at 1339 W 2615 S, Syracuse, UT 84075 and is currently estimated at $1,094,996, approximately $395 per square foot. 1339 W 2615 S is a home located in Davis County with nearby schools including Bluff Ridge Elementary, Legacy Junior High School, and Clearfield High School.
Ownership History
Date
Name
Owned For
Owner Type
Purchase Details
Closed on
Jul 1, 2019
Sold by
Lawson William K and Lawson Sheralee M
Bought by
Lawson William K and Lawson Sheralee M
Current Estimated Value
Purchase Details
Closed on
Jan 17, 2012
Sold by
Wasserlein Williaw T and Wasserlein Felicity A
Bought by
Lawson William K and Lawson Sheralee
Home Financials for this Owner
Home Financials are based on the most recent Mortgage that was taken out on this home.
Original Mortgage
$309,000
Outstanding Balance
$211,639
Interest Rate
3.96%
Mortgage Type
New Conventional
Estimated Equity
$883,357
Purchase Details
Closed on
Oct 9, 2007
Sold by
Rich Doug D and Wasserlein William Thomas
Bought by
Wasserlein William T and Wasserlein Felicity A
Home Financials for this Owner
Home Financials are based on the most recent Mortgage that was taken out on this home.
Original Mortgage
$417,000
Interest Rate
6.4%
Mortgage Type
New Conventional
Create a Home Valuation Report for This Property
The Home Valuation Report is an in-depth analysis detailing your home's value as well as a comparison with similar homes in the area
Home Values in the Area
Average Home Value in this Area
Purchase History
| Date | Buyer | Sale Price | Title Company |
|---|---|---|---|
| Lawson William K | -- | None Available | |
| Lawson William K | -- | Bonneville Superior | |
| Wasserlein William T | -- | Backman Title Services |
Source: Public Records
Mortgage History
| Date | Status | Borrower | Loan Amount |
|---|---|---|---|
| Open | Lawson William K | $309,000 | |
| Previous Owner | Wasserlein William T | $417,000 |
Source: Public Records
Tax History Compared to Growth
Tax History
| Year | Tax Paid | Tax Assessment Tax Assessment Total Assessment is a certain percentage of the fair market value that is determined by local assessors to be the total taxable value of land and additions on the property. | Land | Improvement |
|---|---|---|---|---|
| 2025 | $7,417 | $715,562 | $198,127 | $517,435 |
| 2024 | $6,264 | $689,863 | $194,409 | $495,454 |
| 2023 | $6,264 | $1,084,000 | $249,189 | $834,811 |
| 2022 | $5,733 | $540,100 | $141,668 | $398,432 |
| 2021 | $5,097 | $740,000 | $214,788 | $525,212 |
| 2020 | $4,125 | $579,000 | $170,319 | $408,681 |
| 2019 | $4,088 | $568,000 | $183,348 | $384,652 |
| 2018 | $3,874 | $535,000 | $165,286 | $369,714 |
| 2016 | $3,515 | $262,651 | $67,555 | $195,096 |
| 2015 | $3,705 | $263,696 | $67,555 | $196,141 |
| 2014 | $3,672 | $266,339 | $63,902 | $202,437 |
| 2013 | -- | $233,809 | $68,803 | $165,006 |
Source: Public Records
Map
Nearby Homes
- 2463 S 1375 W
- 2766 S 1200 W
- 1137 W 2500 S
- 2480 S 1150 W
- 1315 W 2325 S
- 1295 W 2325 S
- 2744 S Allison Way Unit 211
- 2742 S Allison Way Unit 212
- 2355 S 1230 W
- 1286 W 2325 S
- 1276 W 2325 S
- 2958 S 1320 W
- 2223 S Allison Way
- 1196 W 2325 S
- 1667 W 2770 S Unit 206
- 1695 W 2770 S Unit 203
- 1697 W 2770 S Unit 202
- 1296 W 2275 S
- 1156 W 2325 S
- 1116 W 2325 S
- 1339 White Sands Ln
- 1342 W 2615 S
- 1342 White Sands Ln
- 1377 White Sands Ln
- 1377 W 2615 S
- 1346 W 2700 S
- 1328 W 2700 S
- 1310 W 2700 S
- 1378 W 2615 S
- 1378 W 2615 S Unit 9
- 1368 W 2700 S
- 1378 White Sands Ln
- 33 E 2250 N
- 1290 W 2700 S
- 1386 W 2700 S
- 2543 S 1300 W
- 2543 S 1300 W Unit 30
- 1423 W 2615 S
- 1423 W 2615 S Unit 13
- 2525 S 1375 W