Estimated Value: $125,000 - $196,436
3
Beds
1
Bath
972
Sq Ft
$155/Sq Ft
Est. Value
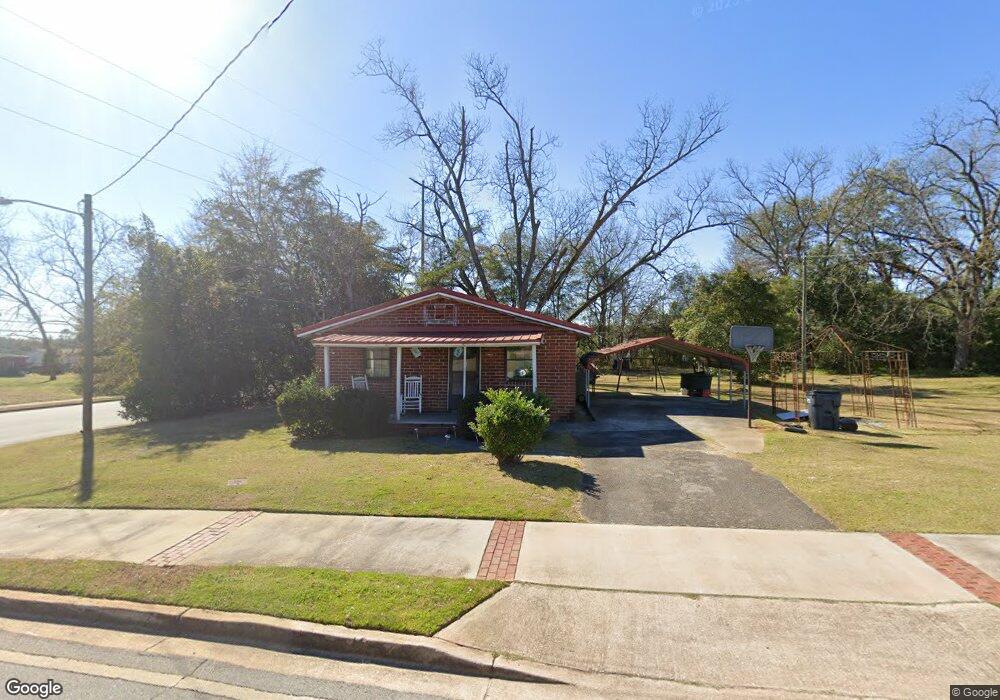
About This Home
This home is located at 1339 Wf Ragin Dr, Perry, GA 31069 and is currently estimated at $150,359, approximately $154 per square foot. 1339 Wf Ragin Dr is a home located in Houston County with nearby schools including Morningside Elementary School, Perry Middle School, and Perry High School.
Ownership History
Date
Name
Owned For
Owner Type
Purchase Details
Closed on
Jul 14, 2025
Sold by
Green Carrie Mae
Bought by
Toomer-Thompson Joann and Green Randolph
Current Estimated Value
Purchase Details
Closed on
Oct 22, 1999
Sold by
Green Charles E Estate
Bought by
Green Carrie Mae
Purchase Details
Closed on
Dec 31, 1993
Sold by
Green Charles E
Bought by
Green Charles E and Carrie Mae*
Purchase Details
Closed on
Aug 24, 1993
Sold by
Hentley Irene G and Norwood Sara
Bought by
Green Charles E
Purchase Details
Closed on
Apr 27, 1992
Sold by
Horne Properties Inc
Bought by
Green James T Estate
Purchase Details
Closed on
Sep 29, 1977
Sold by
Green Charles E
Bought by
Green James T
Purchase Details
Closed on
Aug 22, 1972
Sold by
Roughton D K
Bought by
Green Charles E
Purchase Details
Closed on
Jan 30, 1967
Sold by
Pruitt M R
Bought by
Roughton D K
Purchase Details
Closed on
Jan 10, 1963
Bought by
Roughton Roughton D and Roughton Pruitt M
Create a Home Valuation Report for This Property
The Home Valuation Report is an in-depth analysis detailing your home's value as well as a comparison with similar homes in the area
Home Values in the Area
Average Home Value in this Area
Purchase History
| Date | Buyer | Sale Price | Title Company |
|---|---|---|---|
| Toomer-Thompson Joann | -- | None Listed On Document | |
| Green Carrie Mae | -- | -- | |
| Green Charles E | -- | -- | |
| Green Charles E | -- | -- | |
| Green James T Estate | -- | -- | |
| Green James T | -- | -- | |
| Green Charles E | -- | -- | |
| Roughton D K | -- | -- | |
| Roughton Roughton D | -- | -- |
Source: Public Records
Tax History Compared to Growth
Tax History
| Year | Tax Paid | Tax Assessment Tax Assessment Total Assessment is a certain percentage of the fair market value that is determined by local assessors to be the total taxable value of land and additions on the property. | Land | Improvement |
|---|---|---|---|---|
| 2024 | $1,471 | $40,040 | $25,080 | $14,960 |
| 2023 | $1,061 | $37,400 | $25,080 | $12,320 |
| 2022 | $618 | $36,040 | $25,080 | $10,960 |
| 2021 | $581 | $34,280 | $25,080 | $9,200 |
| 2020 | $590 | $34,240 | $25,080 | $9,160 |
| 2019 | $583 | $34,240 | $25,080 | $9,160 |
| 2018 | $583 | $34,240 | $25,080 | $9,160 |
| 2017 | $584 | $34,240 | $25,080 | $9,160 |
| 2016 | $584 | $34,240 | $25,080 | $9,160 |
| 2015 | $584 | $34,240 | $25,080 | $9,160 |
| 2014 | -- | $34,240 | $25,080 | $9,160 |
| 2013 | -- | $34,240 | $25,080 | $9,160 |
Source: Public Records
Map
Nearby Homes
- 1335 Ball St
- 1312 Sam Nunn Blvd
- 1343 Wf Ragin Dr
- 713 Walcott St
- The Pearson Plan at Avalon
- The Crawford Plan at Avalon
- The Piedmont Plan at Avalon
- The Lawson Plan at Avalon
- The Coleman Plan at Avalon
- The McGinnis Plan at Avalon
- The Harrington Plan at Avalon
- The Bradley Plan at Avalon
- 0 Perimeter Rd Unit 236479
- 0 Perimeter Rd Unit 236478
- 0 Perimeter Rd Unit 20145467
- 202 Obsidian Dr
- 126 Bramblewood Ln
- 104 Pridgen Pass
- 0 Perimeter Roads Unit 20145464
- 113 Pridgen Pass
- 1345 Wf Ragin Dr
- 1333 Wf Ragin Dr
- 1332 Wf Ragin Dr
- 1320 Whipple St
- 1318 Whipple St
- 1325 Wf Ragin Dr
- 1325 Whipple St
- 1324 Wf Ragin Dr
- 1323 Whipple St
- 89 Smith Dr
- 1314 Whipple St
- 1321 Wf Ragin Dr
- 1325 Nolan St
- 1322 Wf Ragin Dr
- 1332 Nolan St
- 1312 Whipple St
- 1319 Whipple St
- 1318 Wf Ragin Dr
- 1317 Wf Ragin Dr
- 1329 Ball St