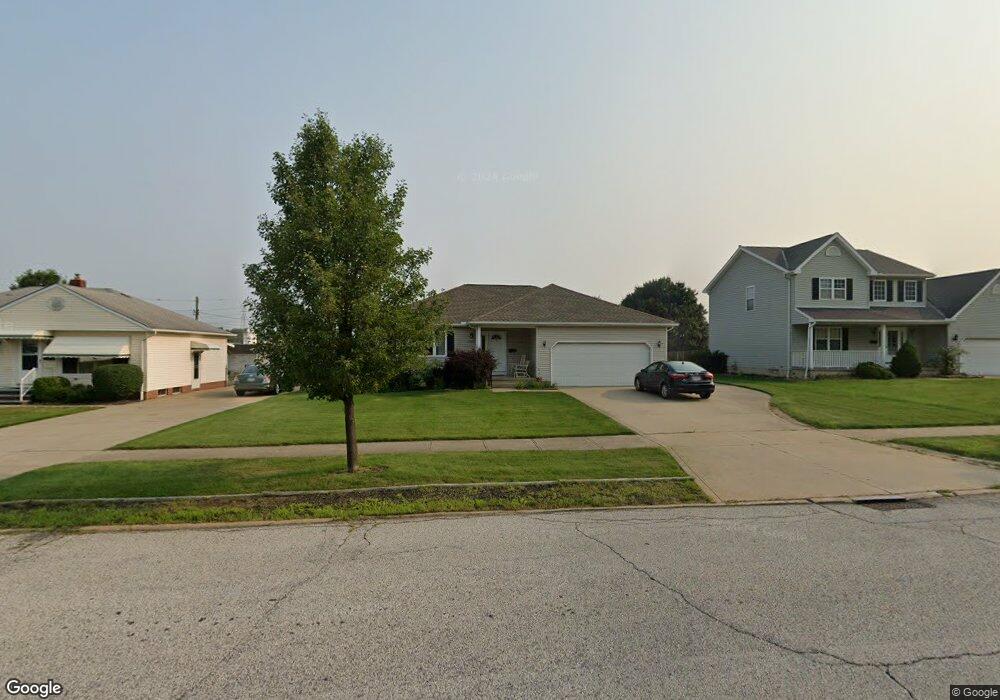
13396 Middlebrook Blvd Brookpark, OH 44142
Estimated Value: $259,000 - $339,042
3
Beds
2
Baths
1,821
Sq Ft
$174/Sq Ft
Est. Value
About This Home
This home is located at 13396 Middlebrook Blvd, Brookpark, OH 44142 and is currently estimated at $316,011, approximately $173 per square foot. 13396 Middlebrook Blvd is a home located in Cuyahoga County with nearby schools including Berea-Midpark Middle School, Berea-Midpark High School, and Huber Heights Preparatory Academy Parma Academy.
Ownership History
Date
Name
Owned For
Owner Type
Purchase Details
Closed on
Feb 29, 2024
Sold by
Valenzeno Anthony M and Valenzeno Marlene A
Bought by
Holt James Robert
Current Estimated Value
Purchase Details
Closed on
Nov 11, 1999
Sold by
Timberview Homes Inc and Dunlap Curtis L
Bought by
Webb Carol A
Home Financials for this Owner
Home Financials are based on the most recent Mortgage that was taken out on this home.
Original Mortgage
$40,000
Interest Rate
7.9%
Purchase Details
Closed on
May 27, 1999
Sold by
Skyline Development Inc and Carney James M
Bought by
Timberview Homes Inc
Purchase Details
Closed on
May 14, 1999
Sold by
The City Of Brook Park Ohio
Bought by
Skyline Development Inc
Create a Home Valuation Report for This Property
The Home Valuation Report is an in-depth analysis detailing your home's value as well as a comparison with similar homes in the area
Home Values in the Area
Average Home Value in this Area
Purchase History
| Date | Buyer | Sale Price | Title Company |
|---|---|---|---|
| Holt James Robert | -- | None Listed On Document | |
| Webb Carol A | $188,000 | American Title & Trust Agenc | |
| Timberview Homes Inc | $10,500 | American Title & Trust Agenc | |
| Skyline Development Inc | -- | American Title & Trust Agenc | |
| Skyline Development Inc | -- | American Title & Trust Agenc |
Source: Public Records
Mortgage History
| Date | Status | Borrower | Loan Amount |
|---|---|---|---|
| Previous Owner | Webb Carol A | $40,000 |
Source: Public Records
Tax History Compared to Growth
Tax History
| Year | Tax Paid | Tax Assessment Tax Assessment Total Assessment is a certain percentage of the fair market value that is determined by local assessors to be the total taxable value of land and additions on the property. | Land | Improvement |
|---|---|---|---|---|
| 2024 | $5,652 | $112,070 | $16,240 | $95,830 |
| 2023 | $4,535 | $83,620 | $12,360 | $71,260 |
| 2022 | $4,528 | $83,620 | $12,360 | $71,260 |
| 2021 | $4,502 | $83,620 | $12,360 | $71,260 |
| 2020 | $3,935 | $66,360 | $9,800 | $56,560 |
| 2019 | $3,818 | $189,600 | $28,000 | $161,600 |
| 2018 | $3,605 | $66,360 | $9,800 | $56,560 |
| 2017 | $3,692 | $60,420 | $8,230 | $52,190 |
| 2016 | $3,662 | $60,420 | $8,230 | $52,190 |
| 2015 | $3,245 | $60,420 | $8,230 | $52,190 |
| 2014 | $3,245 | $57,540 | $7,840 | $49,700 |
Source: Public Records
Map
Nearby Homes
- 13489 Havendale Dr
- 14344 Fayette Blvd
- 14417 Parkman Blvd
- 5677 Gateway Ln Unit E504
- 13602 Holland Rd
- 14055 Donald Dr
- 6274 Anita Dr
- 11914 Tucson Dr
- 13971 Park Dr
- 6333 W 130th St
- 5348 W 147th St
- 6369 Anita Dr
- 13879 Zaremba Dr
- 6330 Michael Dr
- 5882 Kings Hwy
- 5198 W 148th St
- 6413 Alexandria Dr
- 15450 Holland Rd
- 13765 Newton Rd
- 10910 Windham Rd
- 13408 Middlebrook Blvd
- 13384 Middlebrook Blvd
- 13430 Middlebrook Blvd
- 13425 Snow Rd
- 13377 Crestway Dr
- 13452 Middlebrook Blvd
- 13431 Middlebrook Blvd
- 13379 Crestway Dr
- 13474 Middlebrook Blvd
- 13453 Middlebrook Blvd
- 5810 W 130th St
- 13375 Snow Rd
- 13475 Middlebrook Blvd
- 13381 Crestway Dr
- 13353 Snow Rd
- 5820 W 130th St
- 13357 Snow Rd
- 13494 Middlebrook Blvd
- 13430 Crestway Dr
- 13495 Middlebrook Blvd