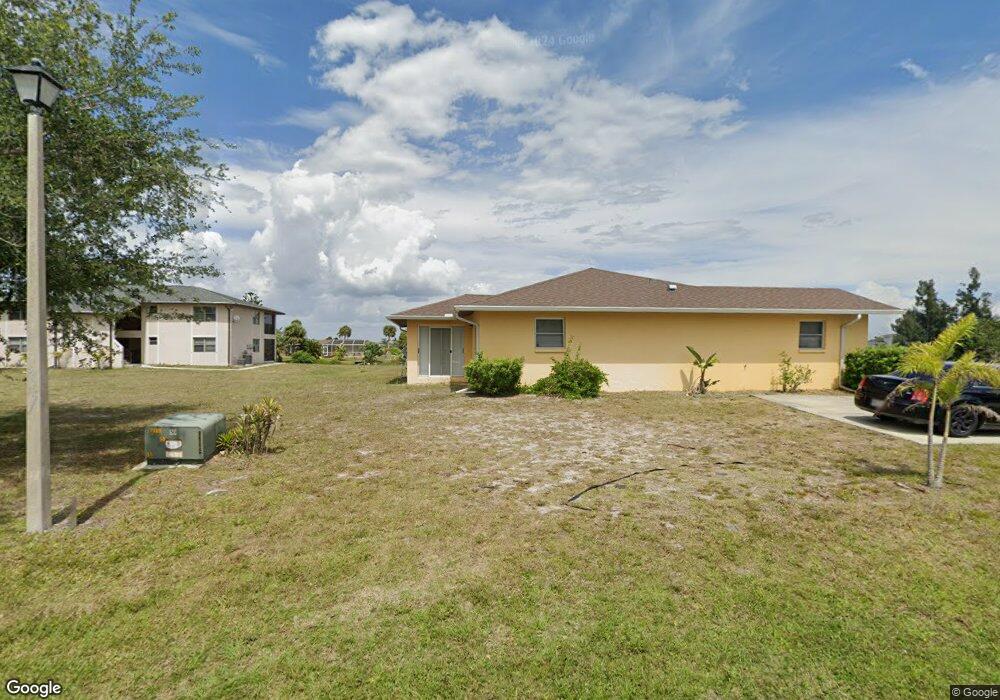
134 Boundary Blvd Unit B Rotonda West, FL 33947
Estimated Value: $342,218 - $509,000
4
Beds
4
Baths
2,357
Sq Ft
$177/Sq Ft
Est. Value
About This Home
This home is located at 134 Boundary Blvd Unit B, Rotonda West, FL 33947 and is currently estimated at $416,055, approximately $176 per square foot. 134 Boundary Blvd Unit B is a home located in Charlotte County with nearby schools including Vineland Elementary School, L.A. Ainger Middle School, and Lemon Bay High School.
Ownership History
Date
Name
Owned For
Owner Type
Purchase Details
Closed on
Feb 16, 2024
Sold by
Delgado Adolfo
Bought by
Royal Family House Llc
Current Estimated Value
Purchase Details
Closed on
Jan 5, 2024
Sold by
Crossroads Sheds Inc
Bought by
Delgado Adolfo
Purchase Details
Closed on
Jan 28, 2022
Sold by
Johnsen Robert W and Johnsen Lynda A
Bought by
Crossroads Sheds Inc
Purchase Details
Closed on
Dec 22, 2017
Sold by
Munson Donald R and Munson Georgia A
Bought by
Johnsen Robert W and Johnsen Lyda A
Purchase Details
Closed on
Dec 16, 2017
Sold by
Munson Donald R and Munson Georgia A
Bought by
Johnsen Robert W and Johnsen Lyda A
Purchase Details
Closed on
Mar 19, 2015
Sold by
Zschuppe Hans G and Zschuppe Rose
Bought by
Munson Donald R and Munson Georgia A
Create a Home Valuation Report for This Property
The Home Valuation Report is an in-depth analysis detailing your home's value as well as a comparison with similar homes in the area
Home Values in the Area
Average Home Value in this Area
Purchase History
| Date | Buyer | Sale Price | Title Company |
|---|---|---|---|
| Royal Family House Llc | $100 | None Listed On Document | |
| Delgado Adolfo | $400,000 | Suncoast One Title & Closings | |
| Crossroads Sheds Inc | $340,000 | Burnt Store Title & Escrow | |
| Johnsen Robert W | -- | None Available | |
| Johnsen Robert W | -- | None Available | |
| Munson Donald R | $140,000 | Attorney |
Source: Public Records
Tax History Compared to Growth
Tax History
| Year | Tax Paid | Tax Assessment Tax Assessment Total Assessment is a certain percentage of the fair market value that is determined by local assessors to be the total taxable value of land and additions on the property. | Land | Improvement |
|---|---|---|---|---|
| 2024 | $8,079 | $388,504 | $48,450 | $340,054 |
| 2023 | $8,079 | $380,494 | $46,240 | $334,254 |
| 2022 | $5,529 | $261,313 | $42,500 | $218,813 |
| 2021 | $4,894 | $180,282 | $17,000 | $163,282 |
| 2020 | $3,037 | $180,064 | $14,620 | $165,444 |
| 2019 | $4,044 | $181,810 | $14,620 | $167,190 |
| 2018 | $3,782 | $176,693 | $13,600 | $163,093 |
| 2017 | $3,086 | $149,325 | $13,600 | $135,725 |
| 2016 | $2,745 | $110,513 | $0 | $0 |
| 2015 | $1,559 | $78,546 | $0 | $0 |
| 2014 | -- | $71,405 | $0 | $0 |
Source: Public Records
Map
Nearby Homes
- 137 Boundary Blvd
- 139 Boundary Blvd
- 143 Boundary Blvd
- 9232 Spring Valley Rd
- 141 Rotonda Cir
- 140 Rotonda Cir
- 142 Rotonda Cir
- 145 Rotonda Cir
- 144 Rotonda Cir
- 146 Rotonda Cir
- 964 Boundary Blvd
- 142 & 144 Boundary Blvd
- 1057 Boundary Blvd
- 833 & 835 Boundary Blvd
- 195 Boundary Blvd
- 121 & 123 Boundary Blvd
- 141 Boundary Blvd
- 470 & 472 Boundary Blvd
- 150 Rotonda Cir
- 169 Boundary Blvd Unit 169P
- 134 Boundary Blvd Unit A & B
- 134 Boundary Blvd
- 132 Boundary Blvd
- 130 Boundary Blvd Unit A & B
- 130 Boundary Blvd
- 136 Boundary Blvd Unit C
- 136 Boundary Blvd
- 136 Boundary Blvd Unit B
- 135 Boundary Blvd
- 135 Boundary Blvd Unit A & B
- 133 Boundary Blvd
- 133 Boundary Blvd Unit 1 & 2
- 138 Boundary Blvd
- 131 Boundary Blvd
- 131 Boundary Blvd Unit A & B
- 131 Boundary Blvd Unit B
- 129 Boundary Blvd Unit 2
- 129 Boundary Blvd
- 126 Boundary Blvd
- 126 Boundary Blvd Unit B