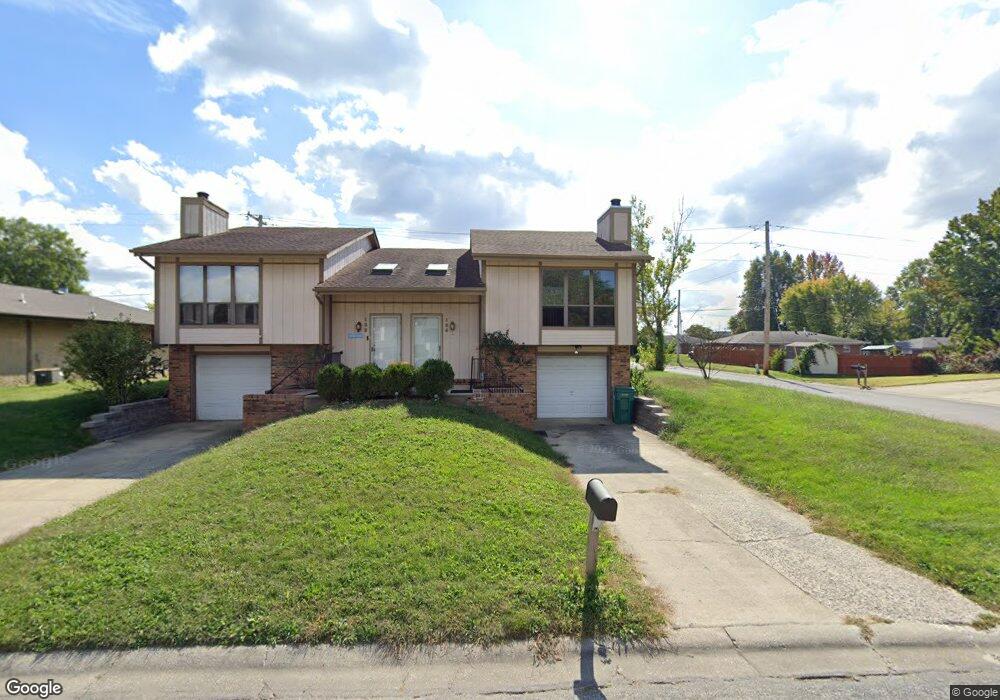
134 Chase Park Dr Belleville, IL 62226
Estimated Value: $97,000 - $132,771
3
Beds
--
Bath
1,400
Sq Ft
$80/Sq Ft
Est. Value
About This Home
This home is located at 134 Chase Park Dr, Belleville, IL 62226 and is currently estimated at $112,693, approximately $80 per square foot. 134 Chase Park Dr is a home located in St. Clair County with nearby schools including Union Elementary School, West Jr High School, and Our Lady Queen Of Peace Catholic School.
Ownership History
Date
Name
Owned For
Owner Type
Purchase Details
Closed on
Apr 10, 2008
Sold by
The Bank Of New York Trust Co Na
Bought by
Alexander Harris Renae F
Current Estimated Value
Home Financials for this Owner
Home Financials are based on the most recent Mortgage that was taken out on this home.
Original Mortgage
$61,850
Outstanding Balance
$38,995
Interest Rate
5.88%
Mortgage Type
Purchase Money Mortgage
Estimated Equity
$73,698
Purchase Details
Closed on
Dec 28, 2007
Sold by
Hughes Taiiko K
Bought by
The Bank Of New York Trust Co
Purchase Details
Closed on
May 7, 2003
Sold by
Garrett Kathryn N
Bought by
Hughes Taiiko K
Home Financials for this Owner
Home Financials are based on the most recent Mortgage that was taken out on this home.
Original Mortgage
$75,000
Interest Rate
8.55%
Mortgage Type
Purchase Money Mortgage
Create a Home Valuation Report for This Property
The Home Valuation Report is an in-depth analysis detailing your home's value as well as a comparison with similar homes in the area
Home Values in the Area
Average Home Value in this Area
Purchase History
| Date | Buyer | Sale Price | Title Company |
|---|---|---|---|
| Alexander Harris Renae F | $62,000 | Fatic | |
| The Bank Of New York Trust Co | -- | None Available | |
| Hughes Taiiko K | $75,000 | Multiple |
Source: Public Records
Mortgage History
| Date | Status | Borrower | Loan Amount |
|---|---|---|---|
| Open | Alexander Harris Renae F | $61,850 | |
| Previous Owner | Hughes Taiiko K | $75,000 |
Source: Public Records
Tax History Compared to Growth
Tax History
| Year | Tax Paid | Tax Assessment Tax Assessment Total Assessment is a certain percentage of the fair market value that is determined by local assessors to be the total taxable value of land and additions on the property. | Land | Improvement |
|---|---|---|---|---|
| 2024 | $629 | $29,972 | $5,535 | $24,437 |
| 2023 | $667 | $26,009 | $5,459 | $20,550 |
| 2022 | $684 | $23,688 | $4,972 | $18,716 |
| 2021 | $705 | $22,716 | $4,768 | $17,948 |
| 2020 | $711 | $21,155 | $4,440 | $16,715 |
| 2019 | $715 | $20,356 | $4,618 | $15,738 |
| 2018 | $722 | $19,836 | $4,500 | $15,336 |
| 2017 | $1,063 | $19,308 | $4,380 | $14,928 |
| 2016 | $977 | $18,642 | $4,229 | $14,413 |
| 2014 | $825 | $18,400 | $4,222 | $14,178 |
| 2013 | $1,121 | $18,400 | $4,222 | $14,178 |
Source: Public Records
Map
Nearby Homes
- 41 Paulette Dr
- 22 Elizabeth Dr
- 102 Kensington Heights Rd
- 2819 Frank Scott Pkwy W
- 11 Kingsway Dr
- 119 Freedom Dr
- 128 Freedom Dr
- 40 Irene Dr
- 18 Jonathon Lee Dr
- 130 Hickory Lake
- 6204 Warren Dr
- 4619 Ruth St
- 4720 Ruth St
- 22 Terrace Dr
- 8 S 51st St
- 44 Gatewood Ct
- 408 Rosewood Ct
- 20 S 44th St
- 140 Willow Creek Rd
- 2264 Frank Scott Pkwy W
- 104106 Chase Park Dr
- 132 Chase Park Dr
- 124126 Chase Park Dr
- 124126 Chase Park Dr Unit 2
- 128 Chase Park Dr
- 129 Elizabeth Dr
- 137 Paulette Dr
- 135 Paulette Dr
- 14 Paulette Dr
- 139 Paulette Dr Unit 141
- 135 Chase Park Dr
- 133 Chase Park Dr
- 201 Elizabeth Dr
- 125 Elizabeth Dr
- 131 Chase Park Dr
- 124 Chase Park Dr
- 129 Chase Park Dr
- 145 Paulette Dr
- 205 Elizabeth Dr