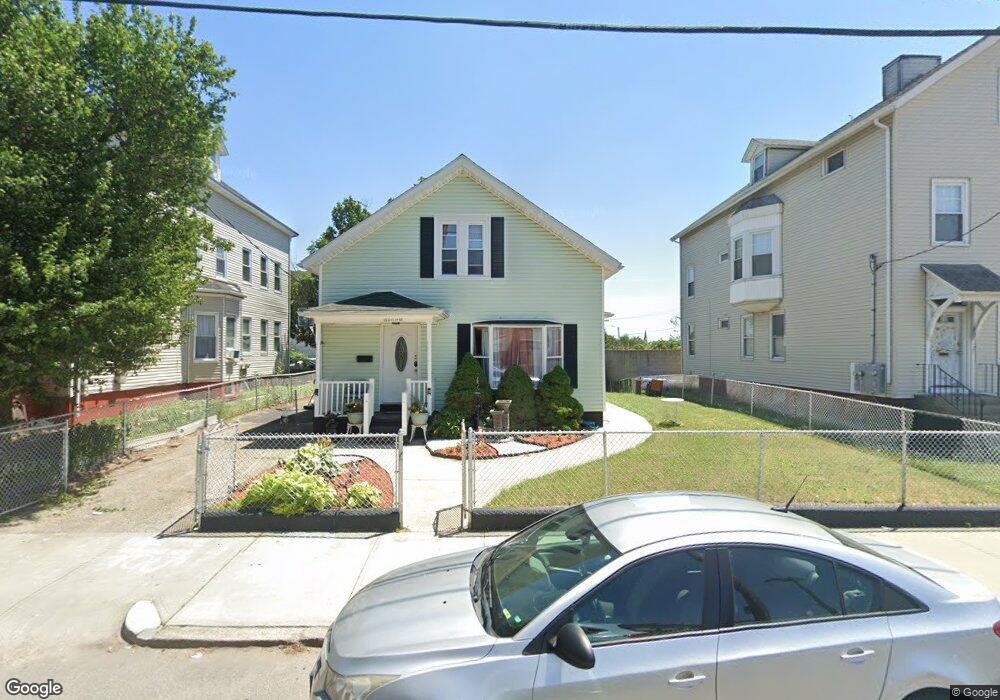
134 Clay St Pawtucket, RI 02860
Downtown Pawtucket NeighborhoodEstimated Value: $289,000 - $361,000
3
Beds
1
Bath
1,540
Sq Ft
$219/Sq Ft
Est. Value
About This Home
This home is located at 134 Clay St, Pawtucket, RI 02860 and is currently estimated at $337,598, approximately $219 per square foot. 134 Clay St is a home located in Providence County with nearby schools including International Charter School, Blackstone Valley Prep Junior High School, and Saint Raphael Academy.
Ownership History
Date
Name
Owned For
Owner Type
Purchase Details
Closed on
Mar 31, 1992
Sold by
Crawley Nancy A
Bought by
Kai Matthew N
Current Estimated Value
Home Financials for this Owner
Home Financials are based on the most recent Mortgage that was taken out on this home.
Original Mortgage
$74,000
Interest Rate
8.66%
Purchase Details
Closed on
Dec 17, 1990
Sold by
Messier Yvonne
Bought by
Crawley Nancy A
Create a Home Valuation Report for This Property
The Home Valuation Report is an in-depth analysis detailing your home's value as well as a comparison with similar homes in the area
Home Values in the Area
Average Home Value in this Area
Purchase History
| Date | Buyer | Sale Price | Title Company |
|---|---|---|---|
| Kai Matthew N | $78,000 | -- | |
| Crawley Nancy A | $40,000 | -- |
Source: Public Records
Mortgage History
| Date | Status | Borrower | Loan Amount |
|---|---|---|---|
| Closed | Crawley Nancy A | $74,000 |
Source: Public Records
Tax History Compared to Growth
Tax History
| Year | Tax Paid | Tax Assessment Tax Assessment Total Assessment is a certain percentage of the fair market value that is determined by local assessors to be the total taxable value of land and additions on the property. | Land | Improvement |
|---|---|---|---|---|
| 2025 | $3,389 | $257,700 | $82,100 | $175,600 |
| 2024 | $3,180 | $257,700 | $82,100 | $175,600 |
| 2023 | $3,036 | $179,200 | $35,900 | $143,300 |
| 2022 | $2,971 | $179,200 | $35,900 | $143,300 |
| 2021 | $2,971 | $179,200 | $35,900 | $143,300 |
| 2020 | $3,156 | $151,100 | $44,800 | $106,300 |
| 2019 | $3,156 | $151,100 | $44,800 | $106,300 |
| 2018 | $3,042 | $151,100 | $44,800 | $106,300 |
| 2017 | $2,588 | $113,900 | $41,000 | $72,900 |
| 2016 | $2,493 | $113,900 | $41,000 | $72,900 |
| 2015 | $2,493 | $113,900 | $41,000 | $72,900 |
| 2014 | $2,357 | $102,200 | $41,000 | $61,200 |
Source: Public Records
Map
Nearby Homes
- 75 Olive St
- 78 Barton St
- 234 Central St Unit 236
- 31-33 Garfield St
- 28 Bayley St Unit 107
- 722 Dexter St Unit 726
- 584 Lonsdale Ave Unit 586
- 264 Weeden St
- 10 Barber Ave
- 396 Roosevelt Ave
- 14 Martin Ct
- 116 Foundry St
- 61 Orchard St Unit 61
- 517 High St
- 511 High St
- 23 Garden St
- 71 Brook St
- 48 Star St
- 66 Perry St
- 30 Foundry St Unit 6