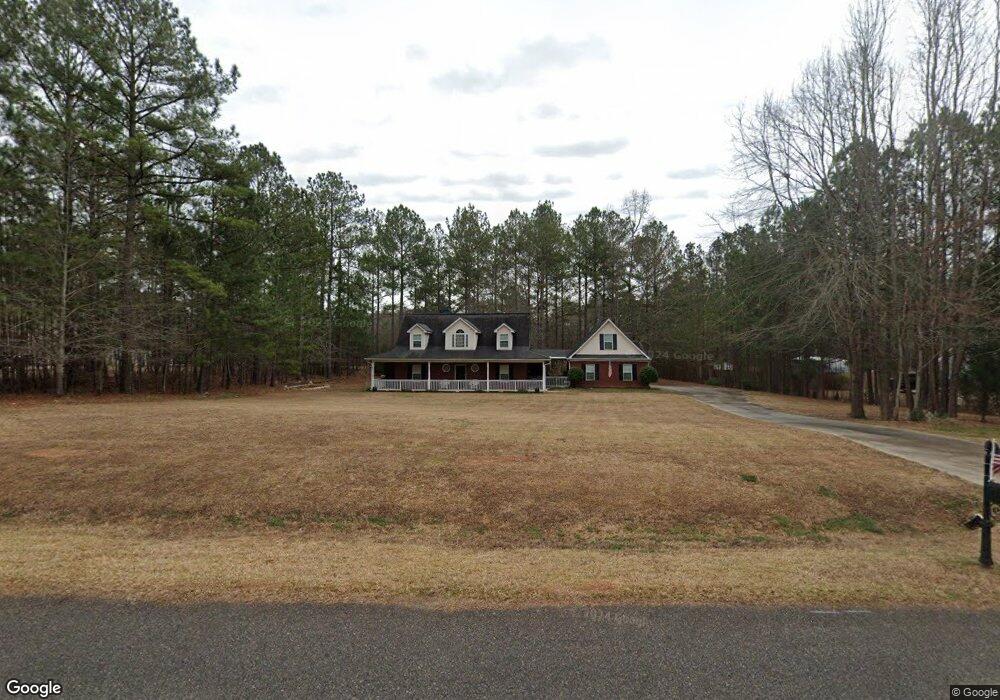
134 Cole Forest Blvd Barnesville, GA 30204
Estimated Value: $372,025 - $410,000
3
Beds
2
Baths
2,148
Sq Ft
$183/Sq Ft
Est. Value
About This Home
This home is located at 134 Cole Forest Blvd, Barnesville, GA 30204 and is currently estimated at $393,506, approximately $183 per square foot. 134 Cole Forest Blvd is a home located in Lamar County with nearby schools including Lamar County Primary School, Lamar County Elementary School, and Lamar County Middle School.
Ownership History
Date
Name
Owned For
Owner Type
Purchase Details
Closed on
Feb 27, 2007
Sold by
Kison Claire J
Bought by
Kison Claire J
Current Estimated Value
Home Financials for this Owner
Home Financials are based on the most recent Mortgage that was taken out on this home.
Original Mortgage
$164,700
Outstanding Balance
$98,416
Interest Rate
6.3%
Mortgage Type
New Conventional
Estimated Equity
$295,090
Purchase Details
Closed on
May 5, 2005
Sold by
Waller Larry D
Bought by
Caldwell Ashley T
Purchase Details
Closed on
Apr 13, 2005
Sold by
First National Bank Of Bar
Bought by
Waller Larry D
Purchase Details
Closed on
Apr 5, 2005
Sold by
Lupton D
Bought by
First National Bank
Purchase Details
Closed on
Jan 4, 2004
Sold by
Cole Forest Llc
Bought by
Lupton William and Lupton Tim
Create a Home Valuation Report for This Property
The Home Valuation Report is an in-depth analysis detailing your home's value as well as a comparison with similar homes in the area
Purchase History
| Date | Buyer | Sale Price | Title Company |
|---|---|---|---|
| Kison Claire J | $183,000 | -- | |
| Kison Claire J | $183,000 | -- | |
| Caldwell Ashley T | $32,000 | -- | |
| Waller Larry D | $204,000 | -- | |
| First National Bank | -- | -- | |
| Lupton William | -- | -- |
Source: Public Records
Mortgage History
| Date | Status | Borrower | Loan Amount |
|---|---|---|---|
| Open | Kison Claire J | $164,700 | |
| Closed | Kison Claire J | $164,700 |
Source: Public Records
Tax History
| Year | Tax Paid | Tax Assessment Tax Assessment Total Assessment is a certain percentage of the fair market value that is determined by local assessors to be the total taxable value of land and additions on the property. | Land | Improvement |
|---|---|---|---|---|
| 2025 | $3,558 | $146,706 | $10,000 | $136,706 |
| 2024 | $3,108 | $121,456 | $10,000 | $111,456 |
| 2023 | $3,317 | $120,160 | $10,000 | $110,160 |
| 2022 | $2,977 | $107,852 | $10,000 | $97,852 |
| 2021 | $2,696 | $89,656 | $12,000 | $77,656 |
| 2020 | $2,711 | $85,644 | $12,000 | $73,644 |
| 2019 | $2,206 | $69,514 | $8,000 | $61,514 |
| 2018 | $2,118 | $69,514 | $8,000 | $61,514 |
| 2017 | $2,107 | $69,514 | $8,000 | $61,514 |
| 2016 | $2,107 | $69,514 | $8,000 | $61,514 |
| 2015 | $2,105 | $69,514 | $8,000 | $61,514 |
| 2014 | $2,040 | $69,514 | $8,000 | $61,514 |
| 2013 | -- | $69,514 | $8,000 | $61,514 |
Source: Public Records
Map
Nearby Homes
- 119 Mylee Cove
- 278 Cole Forest Blvd
- 206 Cole Forest Blvd
- 225 Cole Forest Blvd
- 218 City Pond Rd
- V L Silver Dollar Rd
- 0 Brinkley Rd Unit 10708515
- 0 Brinkley Rd Unit 10708713
- 0 Brinkley Rd Unit 26582523
- 0 Brinkley Rd Unit 26581581
- 134 Belleflower Way
- 0 Silver Dollar Rd Unit 10552561
- 0 Main St Unit 10711218
- 654 Liberty Hill Rd
- 795 Silver Dollar Rd
- 233 Old 41 Hwy
- 104 Savannah Way
- 587 Highway 41 N
- 0 Savannah Way Unit 10712963
- 112 Liberty Hill St
- 142 Cole Forest Blvd
- 126 Cole Forest Blvd
- 134 Evergreen S
- 118 Cole Forest Blvd
- 118 Cole Forest Blvd Unit Lot 118
- 116 Cole Forest Blvd
- 42 Cole Forest Blvd
- 42 Cole Forest Blvd Unit Lot 42
- 116 Cole Forest Blvd Unit 116
- 40 Cole Forest Blvd
- 40 Cole Forest Blvd Unit Lot 40
- 50 Cole Forest Blvd
- 48 Cole Forest Blvd
- 50 Cole Forest Blvd Unit Lot 50
- 48 Cole Forest Blvd Unit Lot 48
- 103 Mcginnis Glen
- 129 Cole Forest Blvd
- 120 Cole Forest Blvd
- 120 Cole Forest Blvd Unit Lot 120
- 148 Cole Forest Blvd
Your Personal Tour Guide
Ask me questions while you tour the home.