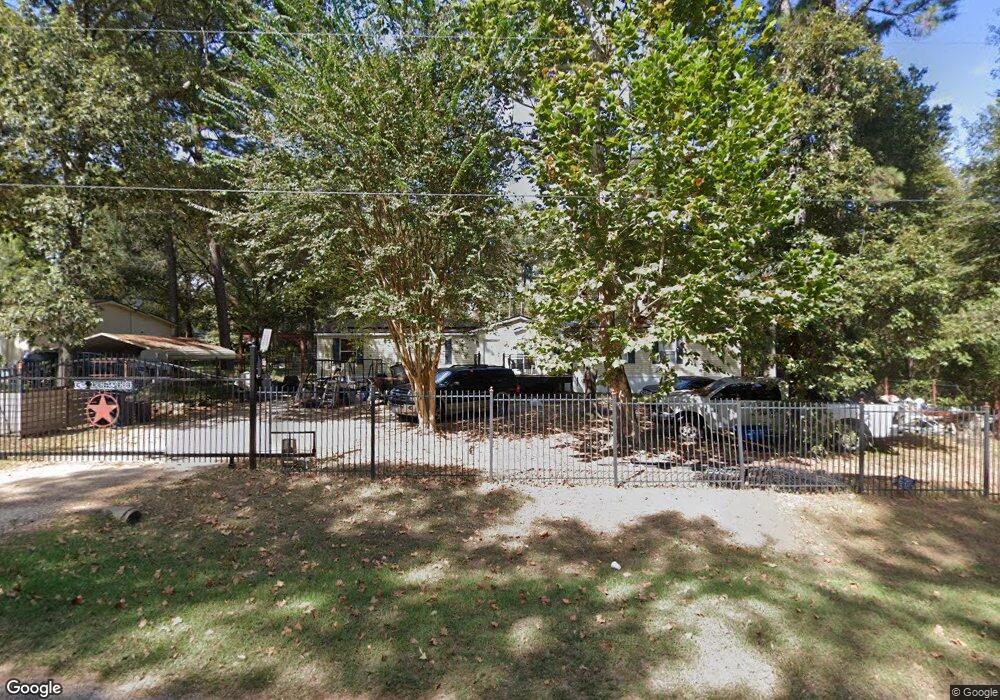
134 Dogwood Dr Magnolia, TX 77355
Estimated Value: $266,000 - $326,000
--
Bed
--
Bath
2,128
Sq Ft
$136/Sq Ft
Est. Value
About This Home
This home is located at 134 Dogwood Dr, Magnolia, TX 77355 and is currently estimated at $289,333, approximately $135 per square foot. 134 Dogwood Dr is a home with nearby schools including Fields Store Elementary School, Schultz Junior High School, and Waller High School.
Ownership History
Date
Name
Owned For
Owner Type
Purchase Details
Closed on
Aug 29, 2014
Sold by
Vandyne April
Bought by
Santamaria Elmer D Vasquez and Fernandez Iris C Sarmiento
Current Estimated Value
Home Financials for this Owner
Home Financials are based on the most recent Mortgage that was taken out on this home.
Original Mortgage
$62,000
Outstanding Balance
$35,208
Interest Rate
11.91%
Mortgage Type
Seller Take Back
Estimated Equity
$254,125
Purchase Details
Closed on
Feb 23, 2011
Sold by
Vanderbilt Mortgage & Finance Inc
Bought by
Vandyne April
Home Financials for this Owner
Home Financials are based on the most recent Mortgage that was taken out on this home.
Original Mortgage
$64,858
Interest Rate
4.73%
Mortgage Type
Seller Take Back
Purchase Details
Closed on
Aug 3, 2010
Sold by
Shanahan Michael A and Shanahan Jeanette A
Bought by
Vanderbilt Mortgage & Finance Inc
Create a Home Valuation Report for This Property
The Home Valuation Report is an in-depth analysis detailing your home's value as well as a comparison with similar homes in the area
Home Values in the Area
Average Home Value in this Area
Purchase History
| Date | Buyer | Sale Price | Title Company |
|---|---|---|---|
| Santamaria Elmer D Vasquez | -- | None Available | |
| Vandyne April | -- | Old Republic Title Co Conroe | |
| Vanderbilt Mortgage & Finance Inc | $49,500 | None Available |
Source: Public Records
Mortgage History
| Date | Status | Borrower | Loan Amount |
|---|---|---|---|
| Open | Santamaria Elmer D Vasquez | $62,000 | |
| Previous Owner | Vandyne April | $64,858 |
Source: Public Records
Tax History Compared to Growth
Tax History
| Year | Tax Paid | Tax Assessment Tax Assessment Total Assessment is a certain percentage of the fair market value that is determined by local assessors to be the total taxable value of land and additions on the property. | Land | Improvement |
|---|---|---|---|---|
| 2025 | $2,554 | $238,280 | $86,250 | $152,030 |
| 2024 | $2,554 | $230,750 | $74,520 | $156,230 |
| 2023 | $2,554 | $234,890 | $74,520 | $160,370 |
| 2022 | $2,368 | $182,950 | $54,860 | $128,090 |
| 2021 | $3,180 | $152,660 | $40,020 | $112,640 |
| 2020 | $3,311 | $155,280 | $40,020 | $115,260 |
| 2019 | $2,628 | $118,030 | $37,950 | $80,080 |
| 2018 | $1,489 | $69,020 | $37,950 | $31,070 |
| 2017 | $1,256 | $57,790 | $25,880 | $31,910 |
| 2016 | $1,394 | $64,150 | $24,150 | $40,000 |
| 2015 | -- | $56,900 | $20,700 | $36,200 |
| 2014 | -- | $71,660 | $31,440 | $40,220 |
Source: Public Records
Map
Nearby Homes
- 290 Greenbriar Dr
- 378 Ridgewood Dr
- 169 Woodway Dr
- 114 Oak Hills Ct
- 126 Oak Hills Ct
- 149 Cedar Ct
- 26501 Red Clover Dr
- 25927 Chicory Dr
- 24433 Fm 1488 Rd
- 26077 Forestcrest Ct
- 25094 Fm 1488 Rd
- 25401 Hunting Trail
- 23442 Hillcrest Dr
- 25330 Settlers Mill
- 25321 Bluff View Ct
- 25003 Joseph Rd
- 24290 Deerbrook Dr
- 25106 Dickens Dr
- 0000 Fm 1488
- 23128 Shakespeare Dr
- 138 Dogwood Dr
- 142 Dogwood Dr
- 126 Dogwood Dr
- 133 Dogwood Dr
- 137 Dogwood Dr
- 122 Dogwood Dr
- 125 Dogwood Dr
- 129 Dogwood Dr
- 150 Dogwood Dr
- 166 Ridgewood Dr
- 118 Dogwood Dr
- 170 Ridgewood Dr
- 149 Dogwood Dr
- 162 Ridgewood Dr
- 186 Ridgewood Dr
- 182 Ridgewood Dr
- 154 Dogwood Dr
- 153 Dogwood Dr
- 158 Ridgewood Dr
- 0 Ridgewood Unit 9196523