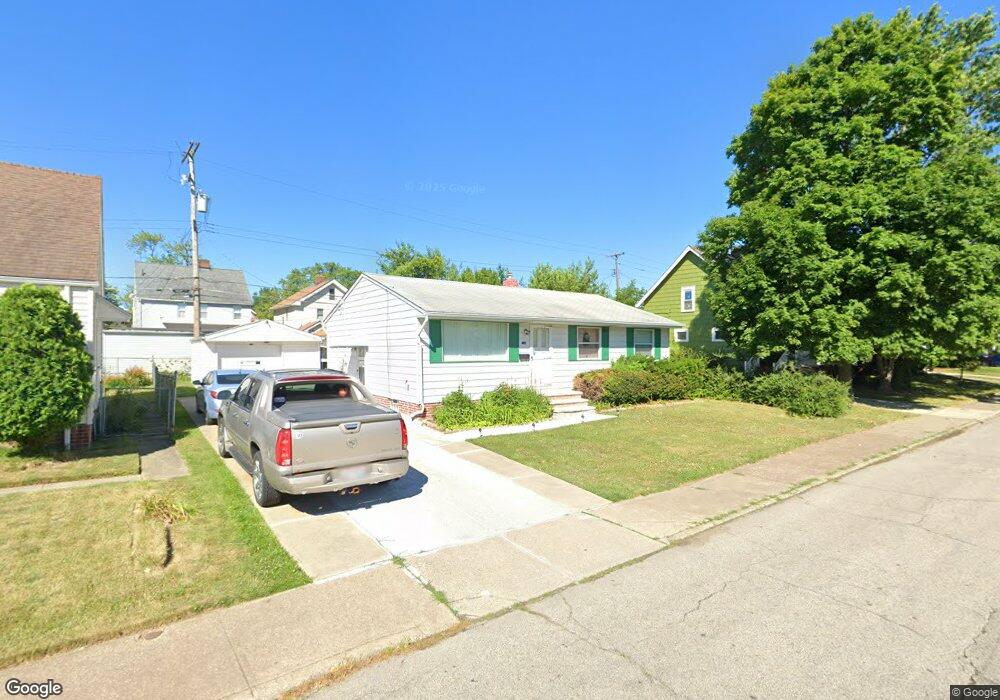
134 E 220th St Euclid, OH 44123
Estimated Value: $148,000 - $208,000
3
Beds
2
Baths
988
Sq Ft
$169/Sq Ft
Est. Value
About This Home
This home is located at 134 E 220th St, Euclid, OH 44123 and is currently estimated at $166,701, approximately $168 per square foot. 134 E 220th St is a home located in Cuyahoga County with nearby schools including Bluestone Elementary School, Euclid High School, and Pinnacle Academy.
Ownership History
Date
Name
Owned For
Owner Type
Purchase Details
Closed on
Jan 25, 2011
Sold by
Phoumyyoth Soulasack and Khim Sophanny
Bought by
Phoumyyoth Bouavan and Phoumyyoth La
Current Estimated Value
Home Financials for this Owner
Home Financials are based on the most recent Mortgage that was taken out on this home.
Original Mortgage
$78,937
Outstanding Balance
$54,656
Interest Rate
5.5%
Mortgage Type
FHA
Estimated Equity
$112,045
Purchase Details
Closed on
Aug 11, 2003
Sold by
Ehrke Donald and Ehrke Albert E
Bought by
Phoumyyoth Soulasack
Home Financials for this Owner
Home Financials are based on the most recent Mortgage that was taken out on this home.
Original Mortgage
$90,543
Interest Rate
5.31%
Mortgage Type
FHA
Purchase Details
Closed on
Jan 26, 2000
Sold by
Ehrke Mary S
Bought by
Ehrke Donald
Purchase Details
Closed on
Nov 3, 1980
Sold by
Errke Albert E
Bought by
Ehrke Mary S
Purchase Details
Closed on
Jan 1, 1975
Bought by
Errke Albert E
Create a Home Valuation Report for This Property
The Home Valuation Report is an in-depth analysis detailing your home's value as well as a comparison with similar homes in the area
Home Values in the Area
Average Home Value in this Area
Purchase History
| Date | Buyer | Sale Price | Title Company |
|---|---|---|---|
| Phoumyyoth Bouavan | $80,000 | Title Xperts Agency Inc | |
| Phoumyyoth Soulasack | $91,500 | Real Living Title Agency Ltd | |
| Ehrke Donald | -- | Midland Title Security Inc | |
| Ehrke Mary S | -- | -- | |
| Errke Albert E | -- | -- |
Source: Public Records
Mortgage History
| Date | Status | Borrower | Loan Amount |
|---|---|---|---|
| Open | Phoumyyoth Bouavan | $78,937 | |
| Previous Owner | Phoumyyoth Soulasack | $90,543 |
Source: Public Records
Tax History
| Year | Tax Paid | Tax Assessment Tax Assessment Total Assessment is a certain percentage of the fair market value that is determined by local assessors to be the total taxable value of land and additions on the property. | Land | Improvement |
|---|---|---|---|---|
| 2025 | $3,303 | $49,665 | $10,115 | $39,550 |
| 2024 | $3,404 | $49,665 | $10,115 | $39,550 |
| 2023 | $2,728 | $31,440 | $5,640 | $25,800 |
| 2022 | $2,666 | $31,430 | $5,640 | $25,800 |
| 2021 | $2,972 | $31,430 | $5,640 | $25,800 |
| 2020 | $3,012 | $29,090 | $5,220 | $23,870 |
| 2019 | $2,708 | $83,100 | $14,900 | $68,200 |
| 2018 | $2,746 | $29,090 | $5,220 | $23,870 |
| 2017 | $2,990 | $26,610 | $5,080 | $21,530 |
| 2016 | $2,996 | $26,610 | $5,080 | $21,530 |
| 2015 | $2,726 | $26,610 | $5,080 | $21,530 |
| 2014 | $2,726 | $26,610 | $5,080 | $21,530 |
Source: Public Records
Map
Nearby Homes
- 170 E 220th St
- 94 E 217th St
- 226 E 216th St
- 336 E 222nd St
- 285 E 216th St
- 55 Sunnycliff Dr
- 461 Kenwood Dr Unit T3
- 450 Kenwood Dr Unit D-12
- 421 Kenwood Dr Unit G
- 324 E 215th St
- 22751 Fox Ave
- 422 Clearview Dr Unit J10
- 521 Kenwood Dr Unit B-5
- 23298 Williams Ave
- 144 E 208th St
- 324 E 235th St
- 442 Clearview Dr Unit U9
- 323 E 235th St
- 273 E 208th St
- 328 E 238th St
Your Personal Tour Guide
Ask me questions while you tour the home.