134 Fairbanks Oak Alley Unit 303 Daniel Island, SC 29492
Daniel Island NeighborhoodEstimated Value: $1,915,660 - $2,977,000
--
Bed
--
Bath
3,240
Sq Ft
$758/Sq Ft
Est. Value
About This Home
This home is located at 134 Fairbanks Oak Alley Unit 303, Daniel Island, SC 29492 and is currently estimated at $2,456,915, approximately $758 per square foot. 134 Fairbanks Oak Alley Unit 303 is a home located in Berkeley County with nearby schools including Daniel Island School and Bishop England High School.
Ownership History
Date
Name
Owned For
Owner Type
Purchase Details
Closed on
Sep 20, 2024
Sold by
Behringer Robert A and Behringer Donna L
Bought by
Van Deventer Family Llc
Current Estimated Value
Purchase Details
Closed on
Jul 9, 2015
Sold by
Bartone Joseph and Truesdell John
Bought by
Behringer Robert A and Behringer Donna L
Purchase Details
Closed on
Jul 7, 2015
Sold by
Di Associates Llc
Bought by
Bartone Joseph and Truesdell John
Purchase Details
Closed on
Feb 14, 2008
Sold by
Daniel Island Riverside Developers Llc
Bought by
Behringer Robert A and Behringer Donna L
Home Financials for this Owner
Home Financials are based on the most recent Mortgage that was taken out on this home.
Original Mortgage
$1,450,000
Interest Rate
5.46%
Mortgage Type
Credit Line Revolving
Create a Home Valuation Report for This Property
The Home Valuation Report is an in-depth analysis detailing your home's value as well as a comparison with similar homes in the area
Home Values in the Area
Average Home Value in this Area
Purchase History
| Date | Buyer | Sale Price | Title Company |
|---|---|---|---|
| Van Deventer Family Llc | $1,850,000 | None Listed On Document | |
| Behringer Robert A | -- | -- | |
| Bartone Joseph | -- | -- | |
| Behringer Robert A | $1,900,000 | None Available |
Source: Public Records
Mortgage History
| Date | Status | Borrower | Loan Amount |
|---|---|---|---|
| Previous Owner | Behringer Robert A | $1,450,000 |
Source: Public Records
Tax History Compared to Growth
Tax History
| Year | Tax Paid | Tax Assessment Tax Assessment Total Assessment is a certain percentage of the fair market value that is determined by local assessors to be the total taxable value of land and additions on the property. | Land | Improvement |
|---|---|---|---|---|
| 2025 | $44,520 | $2,399,600 | $650,000 | $1,749,600 |
| 2024 | $7,013 | $143,976 | $39,000 | $104,976 |
| 2023 | $7,013 | $43,236 | $3,271 | $39,965 |
| 2022 | $6,429 | $37,596 | $40 | $37,556 |
| 2021 | $6,546 | $37,600 | $40 | $37,556 |
| 2020 | $6,680 | $37,596 | $40 | $37,556 |
| 2019 | $6,806 | $37,596 | $40 | $37,556 |
| 2018 | $6,532 | $36,048 | $40 | $36,008 |
| 2017 | $6,521 | $36,048 | $40 | $36,008 |
| 2016 | $6,615 | $36,050 | $40 | $36,010 |
| 2015 | $6,176 | $36,050 | $40 | $36,010 |
| 2014 | $6,168 | $36,050 | $40 | $36,010 |
| 2013 | -- | $36,050 | $40 | $36,010 |
Source: Public Records
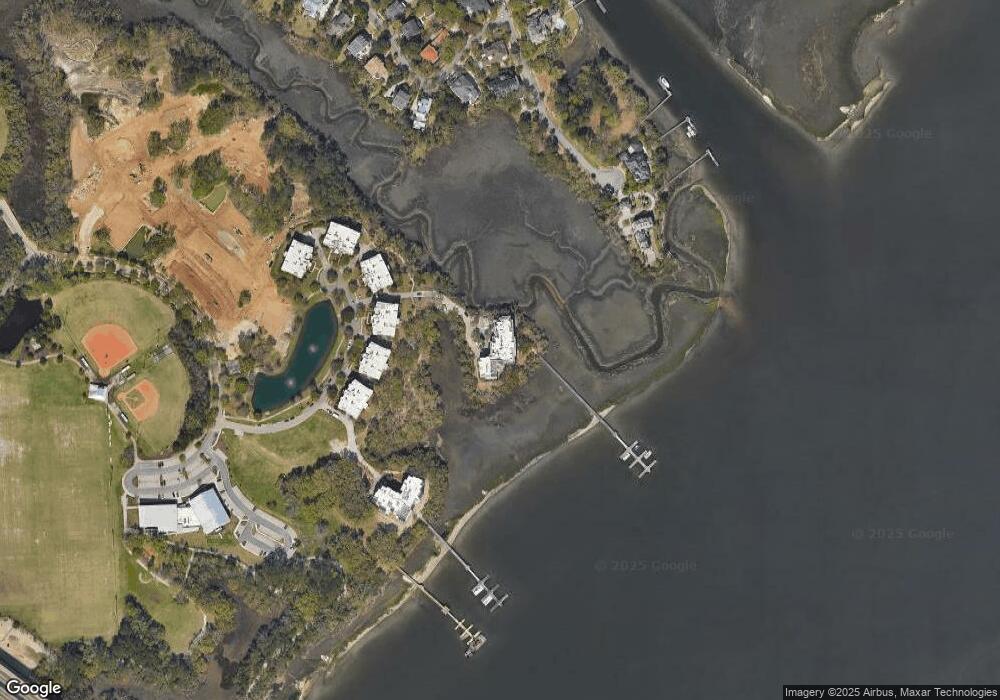
Map
Nearby Homes
- 108 Fairbanks Oak Alley Unit 201
- 108 Fairbanks Oak Alley Unit 402
- 108 Fairbanks Oak Alley Unit 403
- 115 Etta Way
- 117 Etta Way
- 113 Etta Way
- 109 Etta Way
- 107 Etta Way
- 105 Etta Way
- 319 Simone Dr Unit Lot 47
- 120 Etta Way
- 122 Etta Way
- 124 Etta Way
- 323 Simone Dr Unit Lot 48
- 331 Simone Dr Unit Lot 50
- 142 Fairbanks Dr
- 138 Fairbanks Dr
- 140 Fairbanks Dr
- 401 Ralston Creek St
- 347 Simone Dr Unit Lot 54
- 134 Fairbanks Oak Alley Unit 403
- 134 Fairbanks Oak Alley
- 134 Fairbanks Oak Alley
- 134 Fairbanks Oak Alley
- 134 Fairbanks Oak Alley Unit 301
- 134 Fairbanks Oak Alley Unit 203
- 134 Fairbanks Oak Alley Unit N202
- 134 Fairbanks Oak Alley Unit 201
- 134 Fairbanks Oak Alley Unit 402
- 134 Fairbanks Oak Alley Unit 401
- 134 Fairbanks Oak Alley Unit 302
- 201 Fairbanks Oak
- 130 Fairbanks Oak Alley Unit 304
- 130 Fairbanks Oak Alley Unit 303B
- 130 Fairbanks Oak Alley Unit 302
- 130 Fairbanks Oak Alley Unit 301
- 130 Fairbanks Oak Alley Unit 300
- 130 Fairbanks Oak Alley Unit 305
- 130 Fairbanks Oak Alley Unit 4b
- 130 Fairbanks Oak Alley Unit 3b