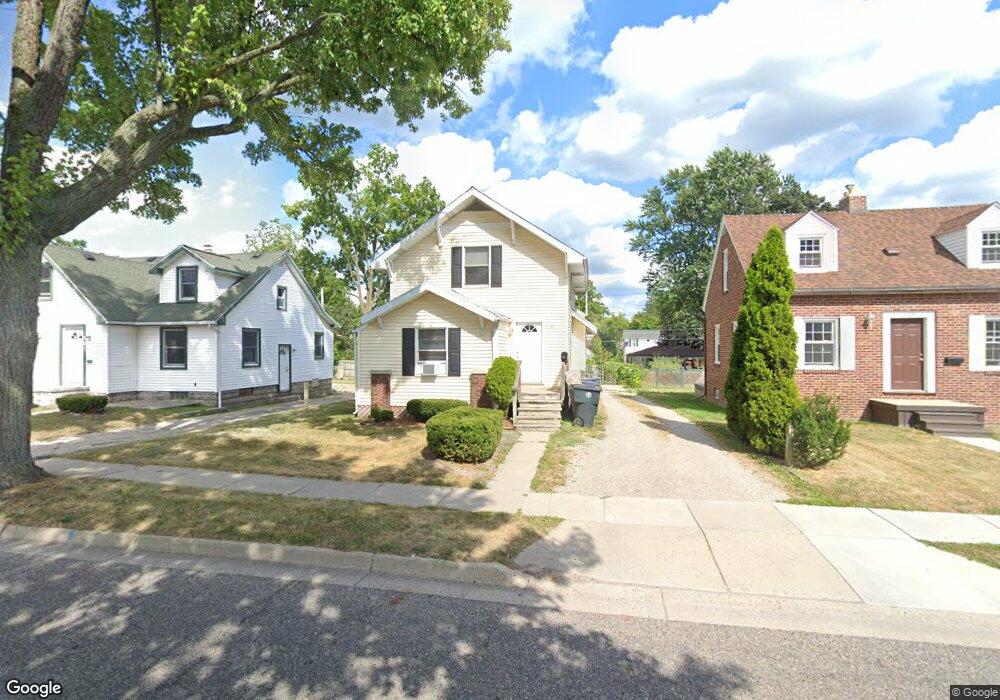
134 Gunson St East Lansing, MI 48823
Estimated Value: $233,000 - $334,000
3
Beds
2
Baths
1,509
Sq Ft
$187/Sq Ft
Est. Value
About This Home
This home is located at 134 Gunson St, East Lansing, MI 48823 and is currently estimated at $282,739, approximately $187 per square foot. 134 Gunson St is a home located in Ingham County with nearby schools including Marble Elementary School, MacDonald Middle School, and East Lansing High School.
Ownership History
Date
Name
Owned For
Owner Type
Purchase Details
Closed on
May 17, 2006
Sold by
Hagan James M and Hagan Mary Anne
Bought by
Jim Hagan Llc
Current Estimated Value
Home Financials for this Owner
Home Financials are based on the most recent Mortgage that was taken out on this home.
Original Mortgage
$301,000
Interest Rate
6.54%
Mortgage Type
Purchase Money Mortgage
Purchase Details
Closed on
Jun 21, 2005
Sold by
Hansen Thelma Dunn and Dunn Thelma M
Bought by
Hagan James M
Create a Home Valuation Report for This Property
The Home Valuation Report is an in-depth analysis detailing your home's value as well as a comparison with similar homes in the area
Home Values in the Area
Average Home Value in this Area
Purchase History
| Date | Buyer | Sale Price | Title Company |
|---|---|---|---|
| Jim Hagan Llc | -- | Professional Title & Mortgag | |
| Hagan James M | $48,000 | -- |
Source: Public Records
Mortgage History
| Date | Status | Borrower | Loan Amount |
|---|---|---|---|
| Closed | Jim Hagan Llc | $301,000 |
Source: Public Records
Tax History Compared to Growth
Tax History
| Year | Tax Paid | Tax Assessment Tax Assessment Total Assessment is a certain percentage of the fair market value that is determined by local assessors to be the total taxable value of land and additions on the property. | Land | Improvement |
|---|---|---|---|---|
| 2025 | $5,488 | $152,800 | $18,900 | $133,900 |
| 2024 | -- | $146,700 | $17,500 | $129,200 |
| 2023 | $5,150 | $135,100 | $15,400 | $119,700 |
| 2022 | $4,927 | $120,200 | $14,000 | $106,200 |
| 2021 | $4,824 | $117,400 | $12,400 | $105,000 |
| 2020 | $4,768 | $131,300 | $12,700 | $118,600 |
| 2019 | $4,599 | $114,900 | $14,400 | $100,500 |
| 2018 | $4,894 | $111,500 | $13,700 | $97,800 |
| 2017 | $4,721 | $108,400 | $15,600 | $92,800 |
| 2016 | -- | $106,300 | $15,400 | $90,900 |
| 2015 | -- | $99,300 | $29,822 | $69,478 |
| 2014 | -- | $94,500 | $29,609 | $64,891 |
Source: Public Records
Map
Nearby Homes
- 15403 Short St
- 214 Kedzie St
- 600 Albert Ave Unit 320
- 600 Albert St Unit 310
- 562 Virginia Ave
- 1542 Ann St
- 704 Beech St
- 696 Beech St
- 586 Lexington Ave
- 657 Spartan Ave
- 1124 Burcham Dr
- 353 Division St
- 919 Collingwood Dr
- 5189 E Brookfield Dr
- 220 M A C Ave Unit 308
- 1653 Ann St
- 635 Division St
- 692 Moorland Dr Unit 10
- 5120 Wardcliff Dr
- 1626 River Terrace