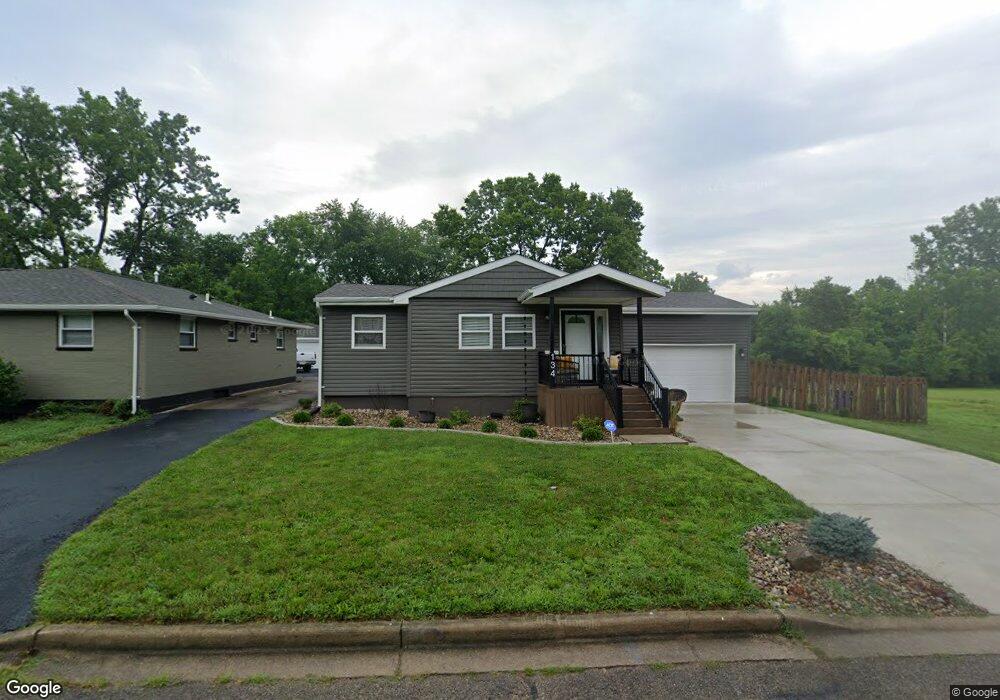
134 Holland Ave Dayton, OH 45417
Estimated Value: $43,000 - $68,644
2
Beds
1
Bath
792
Sq Ft
$66/Sq Ft
Est. Value
About This Home
This home is located at 134 Holland Ave, Dayton, OH 45417 and is currently estimated at $52,661, approximately $66 per square foot. 134 Holland Ave is a home located in Montgomery County with nearby schools including International School at Residence Park, Westwood Elementary, and Louise Troy Elementary.
Ownership History
Date
Name
Owned For
Owner Type
Purchase Details
Closed on
May 6, 2022
Sold by
Parks Scottie C
Bought by
Parks Cyd
Current Estimated Value
Purchase Details
Closed on
Apr 1, 2022
Sold by
Parks Dominique C
Bought by
Parks Cyd
Purchase Details
Closed on
Feb 23, 2022
Sold by
Parks Nichisha S
Bought by
Parks Cyd
Purchase Details
Closed on
Feb 22, 2022
Sold by
Parks Phillip W F
Bought by
Parks Cyd
Purchase Details
Closed on
Feb 21, 2022
Sold by
Parks Bianca R
Bought by
Parks Cyd
Purchase Details
Closed on
Feb 17, 2022
Sold by
Tabor Kimberly L
Bought by
Parks Cyd
Purchase Details
Closed on
Feb 16, 2022
Sold by
Parks Terry A
Bought by
Parks Cyd
Purchase Details
Closed on
Feb 15, 2022
Sold by
Gover Cynthia B
Bought by
Parks Cyd
Create a Home Valuation Report for This Property
The Home Valuation Report is an in-depth analysis detailing your home's value as well as a comparison with similar homes in the area
Home Values in the Area
Average Home Value in this Area
Purchase History
| Date | Buyer | Sale Price | Title Company |
|---|---|---|---|
| Parks Cyd | -- | None Listed On Document | |
| Parks Cyd | -- | None Listed On Document | |
| Parks Cyd | -- | None Listed On Document | |
| Parks Cyd | $1,300 | None Listed On Document | |
| Parks Cyd | $1,300 | None Listed On Document | |
| Parks Cyd | -- | None Listed On Document | |
| Parks Cyd | $1,300 | None Listed On Document | |
| Parks Cyd | $1,300 | None Listed On Document | |
| Parks Cyd | $1,300 | None Listed On Document | |
| Parks Cyd | -- | None Listed On Document | |
| Parks Cyd | -- | None Listed On Document | |
| Parks Cyd | $1,300 | None Listed On Document | |
| Parks Cyd | -- | None Listed On Document |
Source: Public Records
Tax History Compared to Growth
Tax History
| Year | Tax Paid | Tax Assessment Tax Assessment Total Assessment is a certain percentage of the fair market value that is determined by local assessors to be the total taxable value of land and additions on the property. | Land | Improvement |
|---|---|---|---|---|
| 2024 | -- | $5,220 | $890 | $4,330 |
| 2023 | $0 | $5,220 | $890 | $4,330 |
| 2022 | $804 | $5,220 | $890 | $4,330 |
| 2021 | $75 | $5,220 | $890 | $4,330 |
| 2020 | $334 | $5,220 | $890 | $4,330 |
| 2019 | $313 | $4,890 | $680 | $4,210 |
| 2018 | $347 | $4,890 | $680 | $4,210 |
| 2017 | $244 | $4,890 | $680 | $4,210 |
| 2016 | $241 | $4,770 | $680 | $4,090 |
| 2015 | $234 | $4,770 | $680 | $4,090 |
| 2014 | $234 | $4,770 | $680 | $4,090 |
| 2012 | -- | $4,830 | $660 | $4,170 |
Source: Public Records
Map
Nearby Homes
- 6925 W Third St
- 71 Elkins Ave
- 72 Patton Ave
- 163 Drexel Ave
- 4909 W 3rd St
- 764 Miller Ave
- 5357 Dushore Dr
- 5396 Dushore Dr
- 51 N Northampton Ave
- 613 Majestic Dr
- 4972 Dayton Liberty Rd
- 4605 College View Dr
- 1007 Rossiter Dr
- 4615 Dayview Ave
- 4643 Laurel Dr
- 6236 Carmin Ave
- 775 Goodlow Ave
- 773 Goodlow Ave
- 720 Mia Ave
- 361 Roxbury Rd
- 126 Holland Ave
- G29 18201 0230 Holland Ave
- 124 Holland Ave
- 144 Holland Ave
- 137 Oberlin Ave
- 148 Holland Ave
- 127 Oberlin Ave
- 152 Holland Ave
- 127 Holland Ave
- 112 Holland Ave
- 121 Holland Ave
- 113 Oberlin Ave
- 145 Holland Ave
- 153 Holland Ave
- 136 Oberlin Ave
- 100 Holland Ave
- 128 Oberlin Ave
- 124 Oberlin Ave
- 140 Oberlin Ave
- 105 Holland Ave