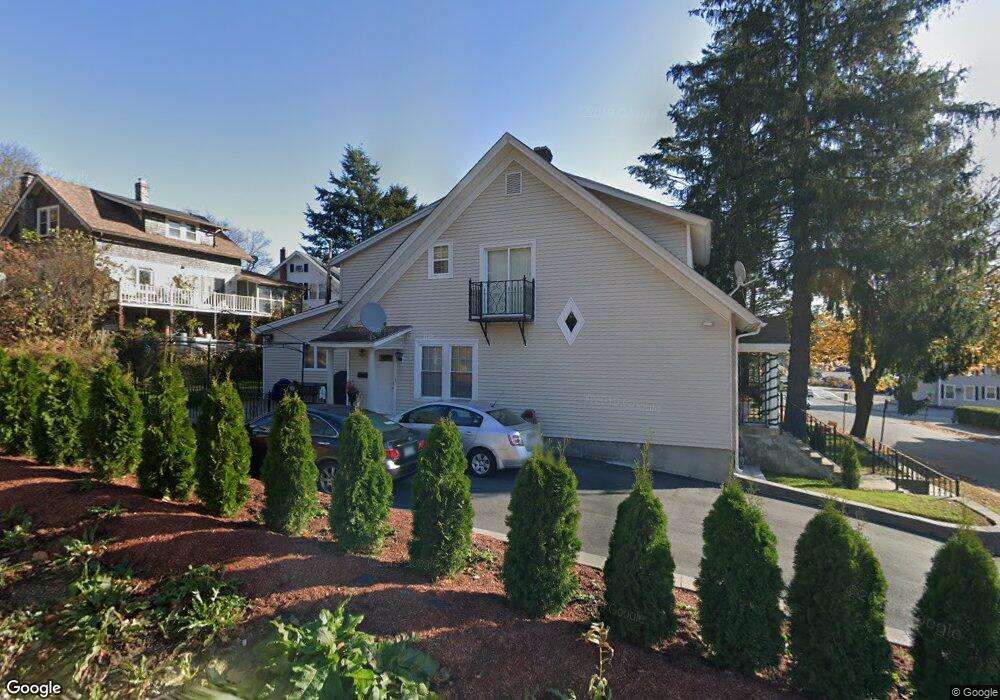
134 Institute Rd Worcester, MA 01602
Salisbury Street NeighborhoodEstimated Value: $401,000 - $516,000
3
Beds
2
Baths
2,036
Sq Ft
$226/Sq Ft
Est. Value
About This Home
This home is located at 134 Institute Rd, Worcester, MA 01602 and is currently estimated at $459,966, approximately $225 per square foot. 134 Institute Rd is a home located in Worcester County with nearby schools including Jacob Hiatt Magnet School, Chandler Magnet, and Flagg Street School.
Ownership History
Date
Name
Owned For
Owner Type
Purchase Details
Closed on
May 22, 2018
Sold by
Bahnan Alfred B and Bahnan Nelly
Bought by
Bahnan Ft and Bahnan
Current Estimated Value
Purchase Details
Closed on
Jun 30, 1989
Sold by
Defeudis Ken
Bought by
Bahnan Alfred
Create a Home Valuation Report for This Property
The Home Valuation Report is an in-depth analysis detailing your home's value as well as a comparison with similar homes in the area
Home Values in the Area
Average Home Value in this Area
Purchase History
| Date | Buyer | Sale Price | Title Company |
|---|---|---|---|
| Bahnan Ft | -- | -- | |
| Bahnan Ft | -- | -- | |
| Bahnan Alfred | $108,000 | -- | |
| Bahnan Alfred | $108,000 | -- |
Source: Public Records
Mortgage History
| Date | Status | Borrower | Loan Amount |
|---|---|---|---|
| Previous Owner | Bahnan Alfred | $50,000 | |
| Previous Owner | Bahnan Alfred | $28,832 | |
| Previous Owner | Bahnan Alfred | $88,000 |
Source: Public Records
Tax History
| Year | Tax Paid | Tax Assessment Tax Assessment Total Assessment is a certain percentage of the fair market value that is determined by local assessors to be the total taxable value of land and additions on the property. | Land | Improvement |
|---|---|---|---|---|
| 2025 | $5,574 | $422,600 | $114,800 | $307,800 |
| 2024 | $5,431 | $395,000 | $114,800 | $280,200 |
| 2023 | $5,241 | $365,500 | $99,900 | $265,600 |
| 2022 | $4,809 | $316,200 | $79,900 | $236,300 |
| 2021 | $4,817 | $295,900 | $63,900 | $232,000 |
| 2020 | $4,695 | $276,200 | $63,900 | $212,300 |
| 2019 | $4,430 | $246,100 | $57,500 | $188,600 |
| 2018 | $4,398 | $232,600 | $57,500 | $175,100 |
| 2017 | $4,236 | $220,400 | $57,500 | $162,900 |
| 2016 | $4,275 | $207,400 | $42,200 | $165,200 |
| 2015 | $4,163 | $207,400 | $42,200 | $165,200 |
| 2014 | $4,053 | $207,400 | $42,200 | $165,200 |
Source: Public Records
Map
Nearby Homes
- 9 Dover St
- 60 Fruit St
- 13 Hampden St
- 3 Marston Way
- 49 Metcalf St
- 59 Beechmont St
- 83 Newton Ave N
- 3 Suburban Rd
- 19 Highland Terrace
- 93 Newton Ave N
- 15 Goulding St
- 38 1/2 Bowdoin St
- 21 Fruit St
- 7 Longworth Rd
- 6 Newton Ave
- 6 Pelham St
- 3A Chalmers Rd
- 29 William St Unit 22
- 80 Salisbury St Unit 206
- 46 Townsend St
Your Personal Tour Guide
Ask me questions while you tour the home.