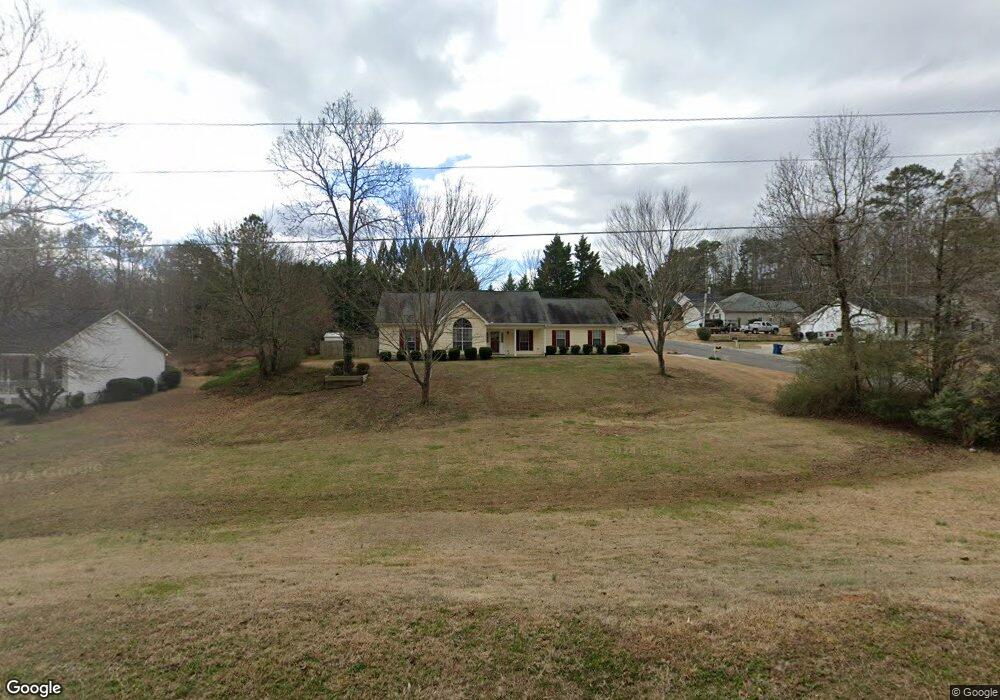
134 Isbell Rd SE Silver Creek, GA 30173
Estimated Value: $227,000 - $302,000
--
Bed
--
Bath
1,447
Sq Ft
$174/Sq Ft
Est. Value
About This Home
This home is located at 134 Isbell Rd SE, Silver Creek, GA 30173 and is currently estimated at $251,819, approximately $174 per square foot. 134 Isbell Rd SE is a home located in Floyd County with nearby schools including Pepperell Middle School, Pepperell High School, and Montessori School of Rome.
Ownership History
Date
Name
Owned For
Owner Type
Purchase Details
Closed on
Jul 31, 2012
Sold by
Parham James E and Parh Ursula I
Bought by
Parham Ursula I
Current Estimated Value
Purchase Details
Closed on
Jan 22, 2008
Sold by
Not Provided
Bought by
Parham James E and Parham Ursula I
Home Financials for this Owner
Home Financials are based on the most recent Mortgage that was taken out on this home.
Original Mortgage
$55,000
Interest Rate
5.79%
Mortgage Type
New Conventional
Purchase Details
Closed on
Sep 10, 2003
Sold by
Bartley Kevin L and Owens April M
Bought by
Mcelveen Samuel L and Mcelvee Debra L
Purchase Details
Closed on
Jul 23, 1998
Sold by
Reich John and Reich Jacquelyn A
Bought by
Bartley Kevin L and Owens April M
Purchase Details
Closed on
May 24, 1996
Sold by
Roberson Jack
Bought by
Reich John and Reich Jacquelyn A
Purchase Details
Closed on
May 3, 1996
Bought by
P and R
Purchase Details
Closed on
Jan 13, 1994
Bought by
Roberson Jack
Create a Home Valuation Report for This Property
The Home Valuation Report is an in-depth analysis detailing your home's value as well as a comparison with similar homes in the area
Home Values in the Area
Average Home Value in this Area
Purchase History
| Date | Buyer | Sale Price | Title Company |
|---|---|---|---|
| Parham Ursula I | -- | -- | |
| Parham James E | $127,500 | -- | |
| Parham James E | $127,500 | -- | |
| Mcelveen Samuel L | $120,000 | -- | |
| Bartley Kevin L | $100,000 | -- | |
| Reich John | $90,900 | -- | |
| P | -- | -- | |
| Roberson Jack | -- | -- |
Source: Public Records
Mortgage History
| Date | Status | Borrower | Loan Amount |
|---|---|---|---|
| Previous Owner | Parham James E | $55,000 |
Source: Public Records
Tax History Compared to Growth
Tax History
| Year | Tax Paid | Tax Assessment Tax Assessment Total Assessment is a certain percentage of the fair market value that is determined by local assessors to be the total taxable value of land and additions on the property. | Land | Improvement |
|---|---|---|---|---|
| 2024 | $703 | $73,134 | $7,352 | $65,782 |
| 2023 | $663 | $71,465 | $7,352 | $64,113 |
| 2022 | $701 | $61,595 | $7,000 | $54,595 |
| 2021 | $710 | $57,114 | $7,000 | $50,114 |
| 2020 | $989 | $55,099 | $7,000 | $48,099 |
| 2019 | $919 | $53,051 | $7,000 | $46,051 |
| 2018 | $851 | $50,898 | $7,000 | $43,898 |
| 2017 | $771 | $48,236 | $7,000 | $41,236 |
| 2016 | $767 | $47,764 | $7,000 | $40,764 |
| 2015 | $733 | $47,764 | $7,000 | $40,764 |
| 2014 | $733 | $47,764 | $7,000 | $40,764 |
Source: Public Records
Map
Nearby Homes
- 9 Woodberry Dr SE
- 29 Crossridge Dr SE
- 74 Preacher Smith Rd
- 169 Jack St SE
- 865 Old Rockmart Rd SE
- 302 Jack St
- 965 Old Rockmart Rd SE
- 11 Ridgeview Dr SE
- 2 Silvermont Dr SE
- 3 Rushden Way SE
- 0 Camelot Cir SE Unit 7662985
- 0 Camelot Cir SE Unit 10621392
- Greenbriar Plan at Three Rivers - Maple Street Collection
- Jensen Plan at Three Rivers - Maple Street Collection
- Yosemite Plan at Three Rivers - Maple Street Collection
- Danville Plan at Three Rivers - Maple Street Collection
- Breckenridge Plan at Three Rivers - Maple Street Collection
- Beacon Plan at Three Rivers - Maple Street Collection
- Wesley Plan at Three Rivers - Maple Street Collection
- DaVinci Plan at Three Rivers - Maple Street Collection
- 148 Isbell Rd SE
- 0 Leslie Ln SE Unit 8206149
- 0 Leslie Ln SE Unit 7469429
- 0 Leslie Ln SE Unit 3227253
- 0 Leslie Ln SE
- 118 Isbell Rd SE
- 5 Leslie Ln SE
- 0 Isbell Rd SE Unit 7268087
- 0 Isbell Rd SE Unit 3274718
- 0 Isbell Rd SE Unit 8764141
- 0 Isbell Rd SE Unit 8235544
- 7 Leslie Ln SE
- 6 Leslie Ln SE
- 116 Isbell Rd SE
- 9 Leslie Ln SE
- 8 Leslie Ln SE
- 10 Leslie Ln SE
- 98 Isbell Rd SE
- 139 Isbell Rd SE
- 111 Isbell Rd SE