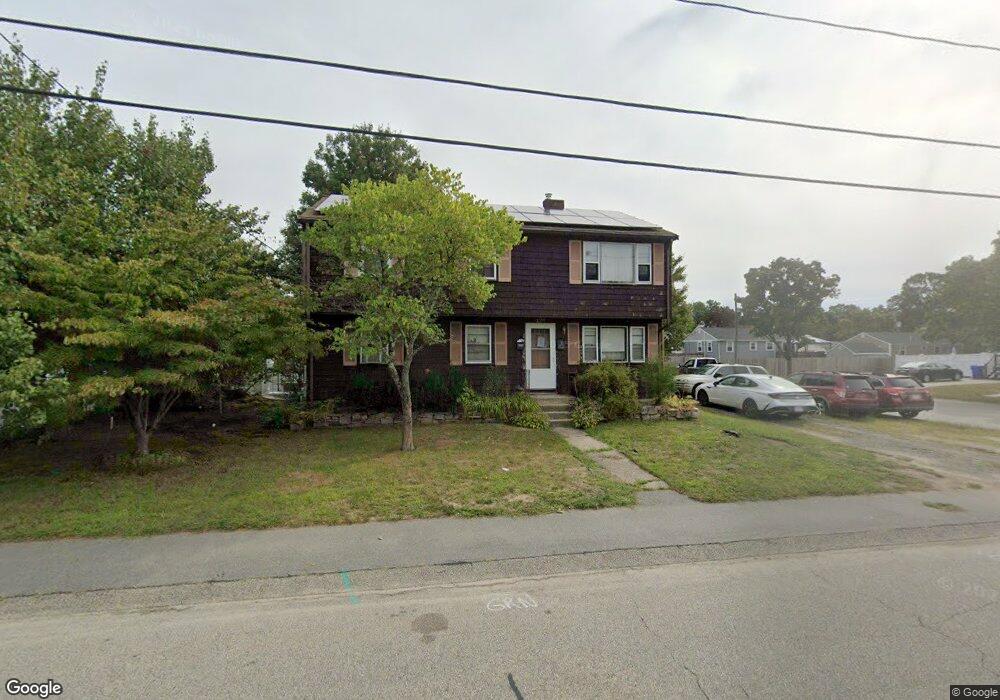
134 Levin Rd Rockland, MA 02370
Estimated Value: $619,000 - $661,000
4
Beds
2
Baths
1,976
Sq Ft
$321/Sq Ft
Est. Value
About This Home
This home is located at 134 Levin Rd, Rockland, MA 02370 and is currently estimated at $635,276, approximately $321 per square foot. 134 Levin Rd is a home located in Plymouth County with nearby schools including Rockland Senior High School, Calvary Chapel Academy, and Holy Family Elementary School.
Ownership History
Date
Name
Owned For
Owner Type
Purchase Details
Closed on
Sep 17, 2020
Sold by
Churchill Paul E and Churchill Linda J
Bought by
Churchill Paul E and Churchill Linda J
Current Estimated Value
Home Financials for this Owner
Home Financials are based on the most recent Mortgage that was taken out on this home.
Original Mortgage
$141,000
Outstanding Balance
$125,128
Interest Rate
2.9%
Mortgage Type
New Conventional
Estimated Equity
$510,148
Purchase Details
Closed on
Sep 17, 2015
Sold by
Ljc Nt
Bought by
Churchill Linda J
Purchase Details
Closed on
Dec 13, 2011
Sold by
Churchill Linda J
Bought by
Ljc Nt
Create a Home Valuation Report for This Property
The Home Valuation Report is an in-depth analysis detailing your home's value as well as a comparison with similar homes in the area
Home Values in the Area
Average Home Value in this Area
Purchase History
| Date | Buyer | Sale Price | Title Company |
|---|---|---|---|
| Churchill Paul E | -- | Stewart Title Guaranty Compa | |
| Churchill Linda J | -- | -- | |
| Ljc Nt | -- | -- | |
| Churchill Linda J | -- | -- |
Source: Public Records
Mortgage History
| Date | Status | Borrower | Loan Amount |
|---|---|---|---|
| Open | Churchill Paul E | $141,000 |
Source: Public Records
Tax History Compared to Growth
Tax History
| Year | Tax Paid | Tax Assessment Tax Assessment Total Assessment is a certain percentage of the fair market value that is determined by local assessors to be the total taxable value of land and additions on the property. | Land | Improvement |
|---|---|---|---|---|
| 2025 | $7,167 | $524,300 | $224,300 | $300,000 |
| 2024 | $6,957 | $494,800 | $211,600 | $283,200 |
| 2023 | $6,911 | $454,100 | $194,100 | $260,000 |
| 2022 | $6,621 | $395,300 | $168,800 | $226,500 |
| 2021 | $6,758 | $360,000 | $153,400 | $206,600 |
| 2020 | $6,148 | $351,300 | $146,200 | $205,100 |
| 2019 | $6,000 | $334,800 | $139,200 | $195,600 |
| 2018 | $5,719 | $313,900 | $139,200 | $174,700 |
| 2017 | $5,513 | $298,300 | $139,200 | $159,100 |
| 2016 | $5,307 | $287,000 | $133,900 | $153,100 |
| 2015 | $5,068 | $266,300 | $125,100 | $141,200 |
| 2014 | $4,741 | $258,500 | $122,700 | $135,800 |
Source: Public Records
Map
Nearby Homes